Deze blog is in ontwikkeling, net begonnen en zal met de tijd groeien:<\/STRONG><\/P><\/P>In de afgelopen jaren heb ik lidar-gekleurd puntwolken gepubliceerd als aanvullingen op de 3D-steden, zoals St. Louis gebied<\/A>, die ik heb gemaakt met behulp van de 3D Basemap-oplossing en het extraheren van gebouwen uit lidar. Sean Morrish schreef een prachtige blog<\/A> over de mechanica van het publiceren van lidar. De laatste tijd heb ik gekeken naar het gebruik van de gekleurde lidar-puntwolken als een effectieve en relatief goedkope manier om 3D Basemaps te maken. Het heeft enkele voordelen omdat de meeste staten, provincies en steden al lidar beschikbaar hebben, de meesten hebben hoge resolutie beelden en allen hebben NAIP-beelden die nodig zijn om deze scènes te creëren. <\/P><\/P>Mantiowoc County lidar scènes:<\/STRONG><\/P>Sommige provincies, steden en staten doen dit al. Manitowoc County, WI., heeft een 3D LiDAR Puntwolk<\/A> en maakt ook scènes<\/A> met de data. Manitowoc County maakte ook een geweldige story map die laat zien hoe hun lidar wordt gebruikt als een gekleurde lidar-puntwolk <\/SPAN>hier<\/A> en raden sterk aan om er eens naar te kijken. <\/SPAN><\/P><\/A><\/P>De StoryMap toont met een video hoe je verticale, horizontale en directe afstanden van LiDAR-grondoppervlakken op elke locatie in de hele provincie kunt vastleggen. Hoe je gedetailleerde metingen kunt verkrijgen van kleine LiDAR-oppervlaktekenmerken zoals de diepte van greppels tot aan de weg. <\/P><\/P>Meet afstanden in LiDAR-puntwolken ten opzichte van LiDAR-grondoppervlakken met behulp van huisdaken als voorbeeld om de hoogte van het gebouw te zien.<\/P><\/P>Hier is een van Manitowoc Buildings scene layer waar ze het creatieve idee hadden om dezelfde gekleurde lidar meerdere keren te gebruiken om nep-zijden van gebouwen te geven door de lidar die als gebouwen is geclassificeerd meerdere keren te tonen, elk met een iets lagere elevatie door de offset in de symbologie te veranderen. Verderop in de blog laat ik zien hoe je dit doet.<\/P>
<\/P>
Mantiowoc County lidar scènes:<\/STRONG><\/P>Sommige provincies, steden en staten doen dit al. Manitowoc County, WI., heeft een
De StoryMap toont met een video hoe je verticale, horizontale en directe afstanden van LiDAR-grondoppervlakken op elke locatie in de hele provincie kunt vastleggen. Hoe je gedetailleerde metingen kunt verkrijgen van kleine LiDAR-oppervlaktekenmerken zoals de diepte van greppels tot aan de weg. <\/P>
Meet afstanden in LiDAR-puntwolken ten opzichte van LiDAR-grondoppervlakken met behulp van huisdaken als voorbeeld om de hoogte van het gebouw te zien.<\/P>
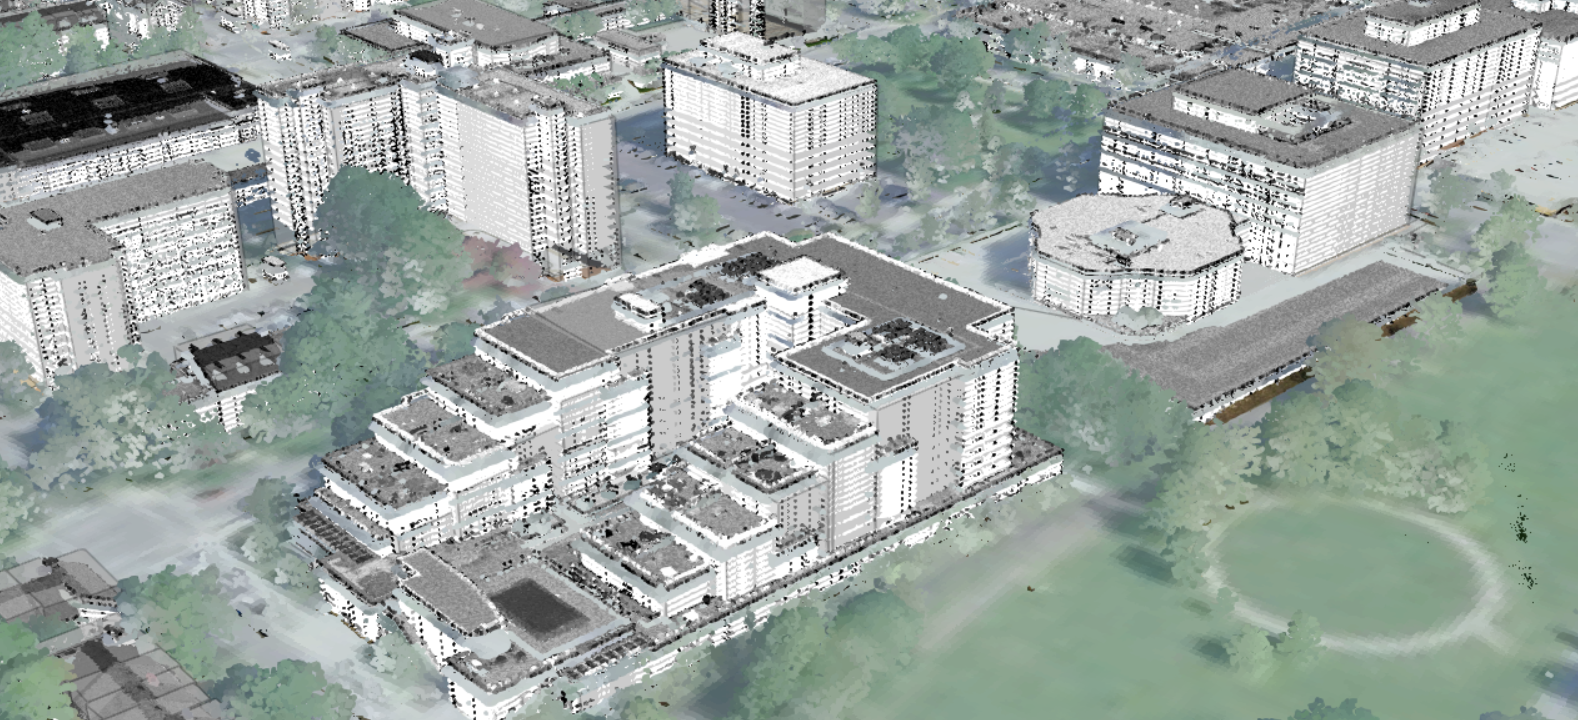
Hier is een van Manitowoc Buildings scene layer waar ze het creatieve idee hadden om dezelfde gekleurde lidar meerdere keren te gebruiken om nep-zijden van gebouwen te geven door de lidar die als gebouwen is geclassificeerd meerdere keren te tonen, elk met een iets lagere elevatie door de offset in de symbologie te veranderen. Verderop in de blog laat ik zien hoe je dit doet.<\/P>
Petje af voor Bruce Riesterer van Manitowoc County die dit allemaal bij elkaar heeft gebracht voordat hij met pensioen ging, inclusief het bedenken van het idee om de gebouwpunten meerdere keren met verschillende kleuren te gebruiken om de zijkanten van gebouwen te tonen en nu werkt hij voor de particuliere sector, zie zijn nieuwe werk bij
<a href="https://uconnclear.maps.arcgis.com/home/webscene/viewer.html?webscene=788d121c4a1f4980b529f914c8df19f4&viewpoint=cam:-72.59232704,38.9122347,175641.36;0.457,58.657" rel="nofollow noopener noreferrer"><img __jive_id="497605" alt="Connecticut 3D Viewer" class="jive-emoji image-10 jive-image j-img-original" src="https://us.v-cdn.net/6038851/uploads/legacyfs/online/497605_Conecticut.jpg"/></a>
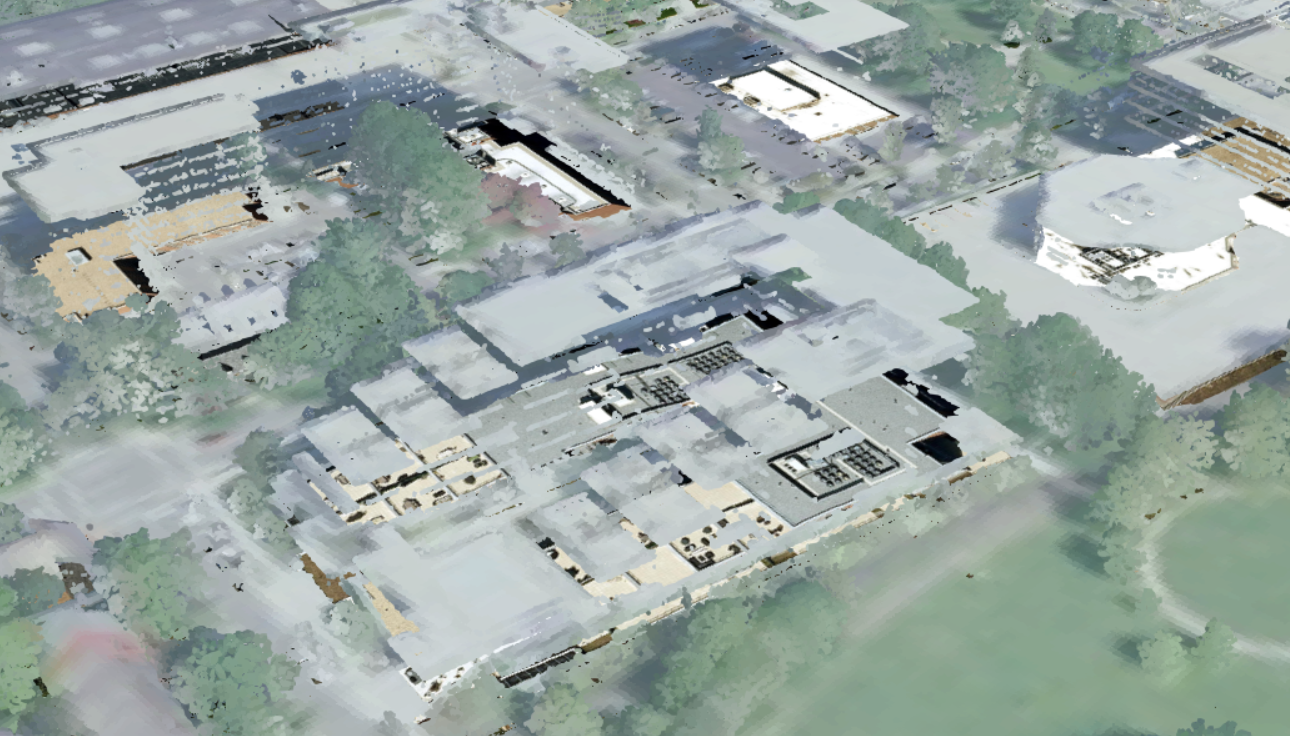
Leaf On High Resolution:<\/SPAN><\/SPAN><\/P><\/SPAN><\/P>Leaf On NAIP:<\/SPAN><\/P><\/SPAN><\/P>Leaf Off High Resolution:<\/SPAN><\/P><\/SPAN><\/P>Soms kan kleurrijke herfstbeelden voordat de bladeren vallen geweldig zijn voor scènes, maar het hangt allemaal af van wat je wilt laten zien.<\/SPAN><\/P><\/P>Manier om bomen toe te voegen met takken en punten als bladeren:<\/STRONG><\/P>Hier is een test die ik heb gedaan met behulp van Dead Tree symbology om de stam en takken weer te geven, terwijl de bladeren afkomstig zijn van de gekleurde lidar. Mijn tool Trees from LIdar of 3D Basemap Solution boomtools kunnen de bomen creëren vanuit lidar en vervolgens kunnen de punten worden gesymboliseerd met het Dead Tree symbool. Deze afbeelding is gemaakt in ArcGIS Pro, niet in een scène.<\/P><\/P><\/P>City of Klaipėda 3D viewer (Litouwen):<\/STRONG><\/P>De
Hier is nog een weergave uitgezoomd:<\/P>
En nog een verder uitgezoomd:<\/P>
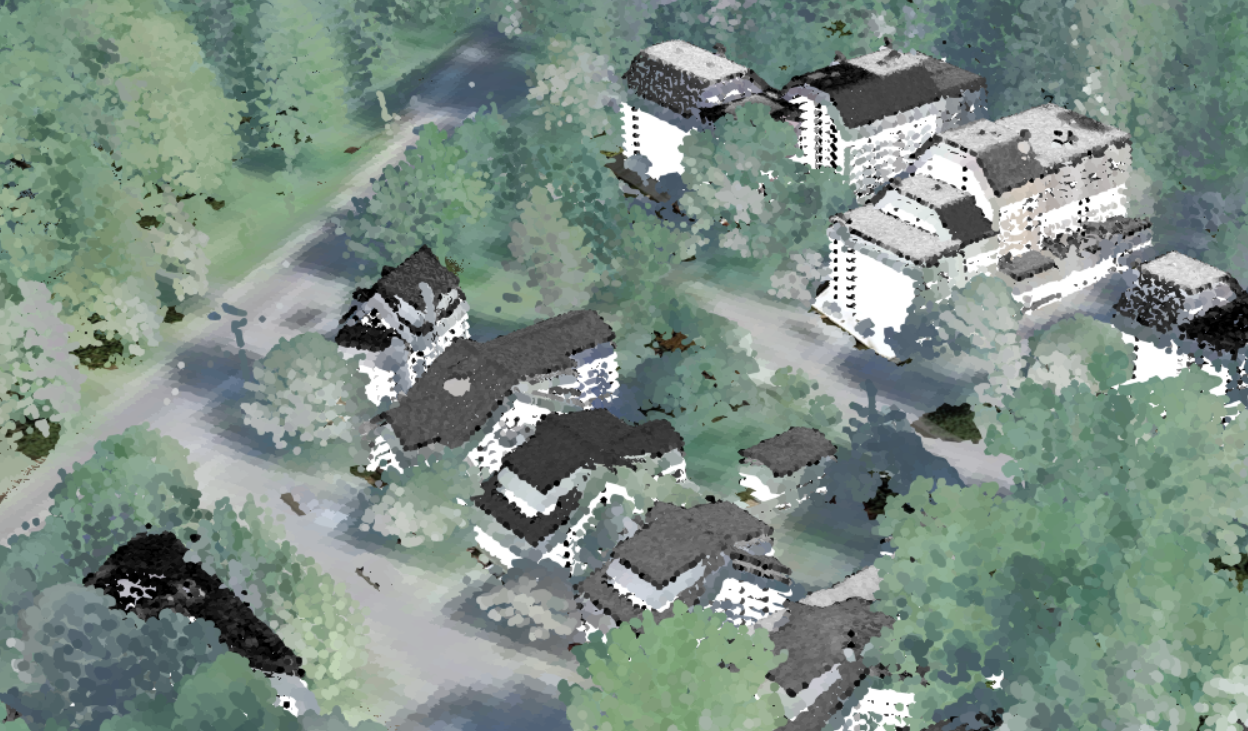
Hieronder staat wat werk waarbij ik de staat Kentucky heb geholpen. Het resultaat lijkt op sommige manieren op het werk van neo-Impressionisten Georges Seurat en Paul Signac die een schildertechniek ontwikkelden genaamd Pointillisme. <\/P>
Kentucky lidar gekleurd:<\/P>
Met de illusie van toegevoegde muren en verdikt dak (Cumberland, KY):<\/P>
Hier is een ander uitzicht dat de zijkanten van het gebouw toont:<\/P>
Het is een illusie met de zijkanten van de gebouwen, de kleuren komen niet overeen met de echte zijkant van de gebouwen en de verschillen in intensiteit van de gebruikte lidar tonen niet de ware verschillen in de zijkanten zoals de waargenomen ramen hierboven. Zoals de meeste illusies of representaties, misleidt het de ogen om te denken dat het de zijkanten van de gebouwen zijn. Soms werkt het, zoals bij de meeste illusies of representaties, niet vanuit alle hoeken zoals dit gebouw deed met een laag aantal punten:<\/P>
Over het algemeen denk ik dat de representatieve zijkanten je helpen te identificeren wat een gebouw is en wat niet. De kleuren van de zijkanten van het gebouw zullen niet overeenkomen met de realiteit, noch tonen ze echte ramen of echte deuren. Dit doen is meestal een zeer kostbaar en tijdrovend proces na het genereren van 3D-modellen van de gebouwen. Je kunt nog steeds de 3D-gebouwen genereren met de Local Government 3D Basemap Solution voor ArcGIS Pro en ze semi-transparant maken en gebruiken voor selectie en analyse zonder enige kleuring. Je kunt ook rpks gebruiken die op de gebouwen worden toegepast om de 3D-modellen nauwkeuriger weer te geven, maar dit zou opnieuw een representatie zijn zonder zeer gedetailleerde gegevens. <\/P>
Hoe gemakkelijk Lidar te verkrijgen voor een groot gebied:<\/STRONG> Hier is een
Basisprincipes van Gekleurde Lidar Puntenwolken, maken van scene layer packages en visualiseren:<\/STRONG><\/P>Hier is een
Hi! Interesting blog. I noticed you have Barnegat Bay Scene Viewer listed under the examples of some colorized lidar to look at. Barnegat Bay is in New Jersey, for those who are curious!
Hi Trish, thanks for the comment. I added the location to it.
Arthur
Hi Arthur - really interesting blog.
I have a question that is semi-related to your blog entry -- more specifically related to your #3 step towards the end of the blog: 3. Looked at the projection in the reports in the meta data downloaded and found it was not supported because it used meters instead of feet, modified a projection and then copied it using a simple model builder tool to give a projection file to each LAS file.
When you say "modified a projection", what exactly are you doing in ArcGIS Pro? I have a las file with a known projection and vertical coordinate system (NAD 1983 (2011) UTM Zone 18N, NAVD88 height - Geoid12A (metres)) but when I generate the las dataset it floats above the surface. This suggests to me that I have in an incorrect vertical reference so I'm trying to figure out how to modify the projection or reproject the lasd to get the stars to align.
See below.
Any thoughts?
Hello John,
What I did was saw the vertical projection in meters, but the one list was in feet. Here's the text in that projection file: USGS_LPC_CA_Wildfires_B1_2018_w1927n1436_LAS_2019.prj
PROJCS["NAD_1983_2011_Contiguous_USA_Albers",GEOGCS["GCS_NAD_1983_2011",DATUM["D_NAD_1983_2011",SPHEROID["GRS_1980",6378137.0,298.257222101,AUTHORITY["EPSG",7019]],AUTHORITY["EPSG",1116]],PRIMEM["Greenwich",0.0,AUTHORITY["EPSG",8901]],UNIT["Degree",0.0174532925199433,AUTHORITY["EPSG",9102]],AUTHORITY["EPSG",6318]],PROJECTION["Albers",AUTHORITY["Esri",43007]],PARAMETER["False_Easting",0.0,AUTHORITY["Esri",100001]],PARAMETER["False_Northing",0.0,AUTHORITY["Esri",100002]],PARAMETER["Central_Meridian",-96.0,AUTHORITY["Esri",100010]],PARAMETER["Standard_Parallel_1",29.5,AUTHORITY["Esri",100025]],PARAMETER["Standard_Parallel_2",45.5,AUTHORITY["Esri",100026]],PARAMETER["Latitude_Of_Origin",23.0,AUTHORITY["Esri",100021]],UNIT["Meter",1.0,AUTHORITY["EPSG",9001]],AUTHORITY["EPSG",6350]],VERTCS["NAVD88 (height) (ftUS)_1",VDATUM["North_American_Vertical_Datum_1988",AUTHORITY["EPSG",5103]],PARAMETER["Vertical_Shift",0.0,AUTHORITY["Esri",100006]],PARAMETER["Direction",1.0,AUTHORITY["Esri",100007]],UNIT["Meter",1.0,AUTHORITY["EPSG",9001]]]
Where the "Meter" is was originally "Feet", so I changed it. You can do this manually or in ArcGIS Pro by modifying the projection and saving it. I created a simple model with an iterator that would run through the las files and copy the projection file so it would match each las file.
It's looks to me yours might be in meters, but need to be set to feet, from the image you shared. Basically, the opposite of what I did with the Redlands lidar. You can create a projection file for one tile, change it from meters to feet and see if it works.
Here's one that might work, copy and paste below into a txt file. Then rename with las name and change from .txt file to .prj.
PROJCS["NAD_1983_2011_UTM_Zone_18N",GEOGCS["GCS_NAD_1983_2011",DATUM["D_NAD_1983_2011",SPHEROID["GRS_1980",6378137.0,298.257222101]],PRIMEM["Greenwich",0.0],UNIT["Degree",0.0174532925199433]],PROJECTION["Transverse_Mercator"],PARAMETER["False_Easting",500000.0],PARAMETER["False_Northing",0.0],PARAMETER["Central_Meridian",-75.0],PARAMETER["Scale_Factor",0.9996],PARAMETER["Latitude_Of_Origin",0.0],UNIT["Meter",1.0],AUTHORITY["EPSG",6347]],VERTCS["NAVD88_height_(ftUS)",VDATUM["North_American_Vertical_Datum_1988"],PARAMETER["Vertical_Shift",0.0],PARAMETER["Direction",1.0],UNIT["Foot_US",0.3048006096012192],AUTHORITY["EPSG",6360]]
I'll be on the question and answer team for the Imagery Showcase booth this year for Elevation and Lidar if you want to ask some questions in person.
Thanks,
Arthur Crawford
Living Atlas Team/Community Maps
Thanks Arthur!
I was able to resolve my vertical problem. I will seek out the Imagery Showcase booth (virtually) with other questions I have.
Speaking of which, I get to the Colorize Las stage of your workflow and no matter what adjustments I make to the tool settings, I still just end up with a grey colorized lasd. I'm thinking I must be missing something really basic but the solution hasn't been forthcoming! See attached.
It looks like you are using NAIP as an imagery source. Did you download the NAIP locally and is it matching the area of the point cloud?
Arthur Crawford - Esri
Thanks, Arthur. I did download the NAIP locally and it matched the area of the point cloud, so I'm not sure what the issue was.
However, I performed the same colorization using ESRI's NAIP service and it worked perfectly!
Thanks again.
Arthur CrawfordIs there a way to smooth multipatch?
Hi Rickey, good to hear from you. How's Ashland theses days? There is not a real good way to do that right now. It's something we have asked for, several universities and companies are working on. The goal would be to take a tin building and then flatten the roofs, superstructure and the sides of the buildings. I assume this is a building generated from a tin approach. There is some ideas of taking the planes generated to extend to the outside of the building polygon. Have you tried to segment roof tool with the Local Government 3D Basemap Solution?
Arthur Crawford
This was made from lidar points using LAS building Multipatch. I have tried different Simplification Tolerance but I have found one that works.
Hi Rickey,
Is your intent to use the multipatches for analysis and use a colorized point cloud for rendering? I did something like that for Chicago using the LOD1/LOD2 buildings with a transparency. With the 3D trees in as multipatches as per the Local Government 3D Basemap, you could do some nice 3D analysis like line of sight or flood estimations with it. With both set to a 100% transparency, then use the point cloud for rendering quickly.
At this point whatever I can display nicely online is what I will go with.
Hi @ArthurCrawford,
Very cool looking scenes!
Can you colorize a point cloud scene layer with imagery?
Simon
@ArthurCrawford I wanted to share the St. Louis imagery web app linked in the blog (https://www.arcgis.com/home/webscene/viewer.html?webscene=6ece8b4050294139969fc4c10ad6b9b1) with my students in a Geovisualization and Cartography class. When we log in to our org we can see it, but we get a few layers that are "service not found" or "You do not have permission to access this resource". They are:
St Louis Iconic Waterfront Features 3D
City of St. Louis Lidar Dec 2016 Colorized
CityofStLouis_6_27_2018
Was trying to show them how the Colorize LAS tool worked and our computers were not happy (end of semester and not great graphics cards) but the colorized lidar was not showing up in this. 🙂 Thanks in advance.
Best, @shannonhwhite (not sure why its not defaulting to my wm-gis org account but either way I will get it).
Aangemelde leden kunnen berichten plaatsen, updates volgen en meer. Nieuw hier? Registreer een gratis account.
Find useful guides, FAQs, and documents to help you navigate and make the most of Esri Community.