I created a dojox chart using the Info window with chart tutorial.
I am using info window and the Measurement widget but this combination seems not to be working because every time you click to create a measurement the info window appears and covers your region of interest.
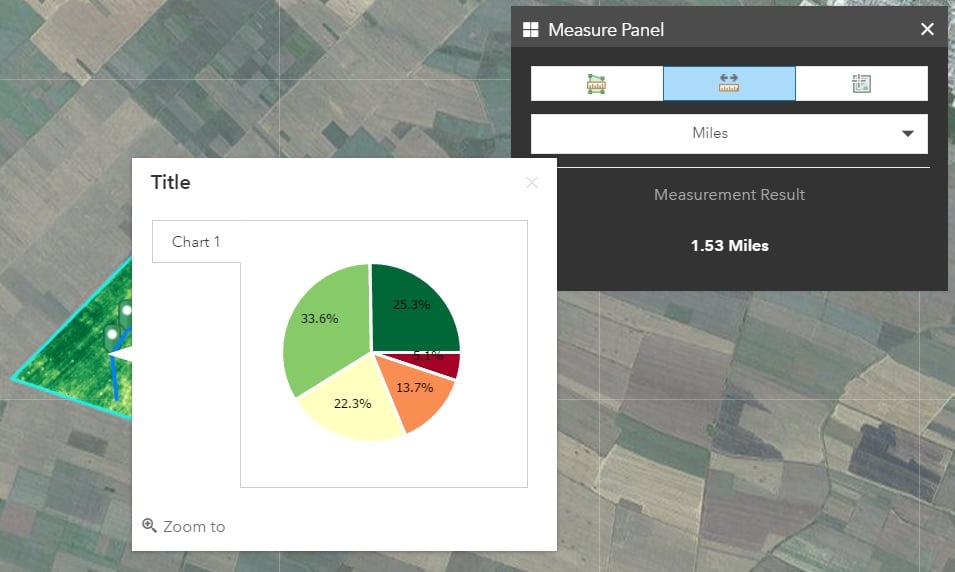
One solution would be to dock the popups but that is only available in JavaScript 4.x which does not support the Measurement widget.
So I guess I need to put the popups in a panel.
I used the sample code from the Popup content in side panel tutorial to integrate the popups in my Popup Panel but I am missing something in the code because it's not working.
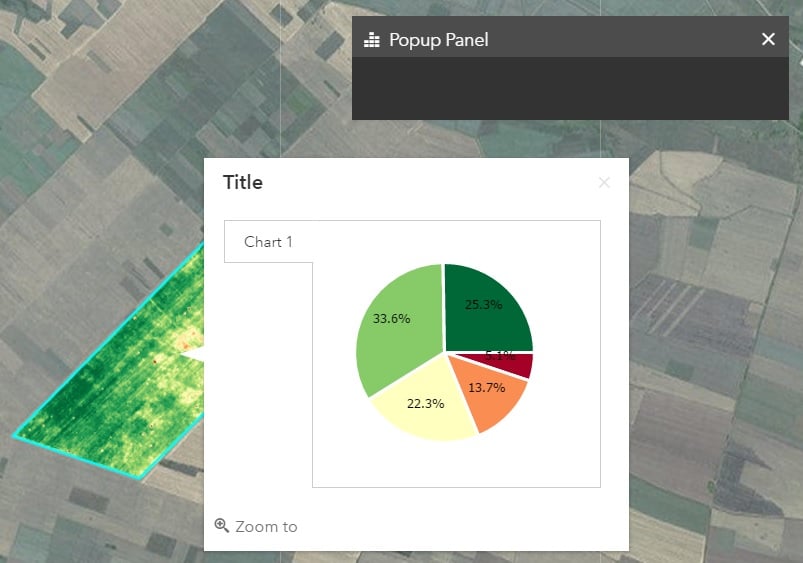
Any support with the code would be very helpful.
My map in the ESRI Calcite Maps theme is available on JS Bin.
<SPAN class="comment token">// From tutorial "Popup content in side panel" </SPAN>
<SPAN class="keyword token">function</SPAN><SPAN class="punctuation token">(</SPAN>error<SPAN class="punctuation token">)</SPAN><SPAN class="punctuation token">{</SPAN>
console<SPAN class="punctuation token">.</SPAN><SPAN class="token function">log</SPAN><SPAN class="punctuation token">(</SPAN><SPAN class="string token">"Map creation failed: "</SPAN><SPAN class="punctuation token">,</SPAN> dojo<SPAN class="punctuation token">.</SPAN><SPAN class="token function">toJson</SPAN><SPAN class="punctuation token">(</SPAN>error<SPAN class="punctuation token">)</SPAN><SPAN class="punctuation token">)</SPAN><SPAN class="punctuation token">;</SPAN>
<SPAN class="punctuation token">.</SPAN><SPAN class="punctuation token">.</SPAN><SPAN class="punctuation token">.</SPAN>
<SPAN class="operator token"><</SPAN><SPAN class="operator token">/</SPAN>script<SPAN class="operator token">></SPAN><SPAN class="line-numbers-rows"><SPAN></SPAN><SPAN></SPAN><SPAN></SPAN><SPAN></SPAN><SPAN></SPAN></SPAN>Thank you,
Michelle



