Flexible Data Slider Filter Widget
Many datasets include attributes that are best explored through continuous ranges rather than discrete selections or manual numeric entry. The intent is to provide creators and end‑users with a intuitive, visual, and flexible tool for filtering data by selecting a range of numeric or temporal values. While Experience Builder currently supports filtering through the Filter widget, numeric inputs, and the Timeline widget (for date fields), there is no dedicated, general‑purpose slider that allows users to interactively define a interval or values range across multiple data types. A Data Slider Filter widget would be a powerful addition to ArcGIS Experience Builder, filling a current gap in interactive filtering tools. By supporting numeric, percentage, temporal, and other continuous data types, it would unlock new possibilities for dashboards, public‑facing apps, and analytical experiences. This enhancement would provide users with a more intuitive, engaging, and flexible way to explore data (See attached esri-style interface mockup).
Proposed Functionality:
The Slider Filter widget would allow Experience Builder authors to:
- Bind the slider to any numeric or date field
- Choose between single-value or range mode
- Set minimum and maximum values (manual or auto-detected from the dataset)
- Define step intervals (e.g., 1 year, 5%, 30 days)
- Apply filters automatically or on user confirmation
- Trigger actions on connected widgets (maps, tables, charts, text, lists)
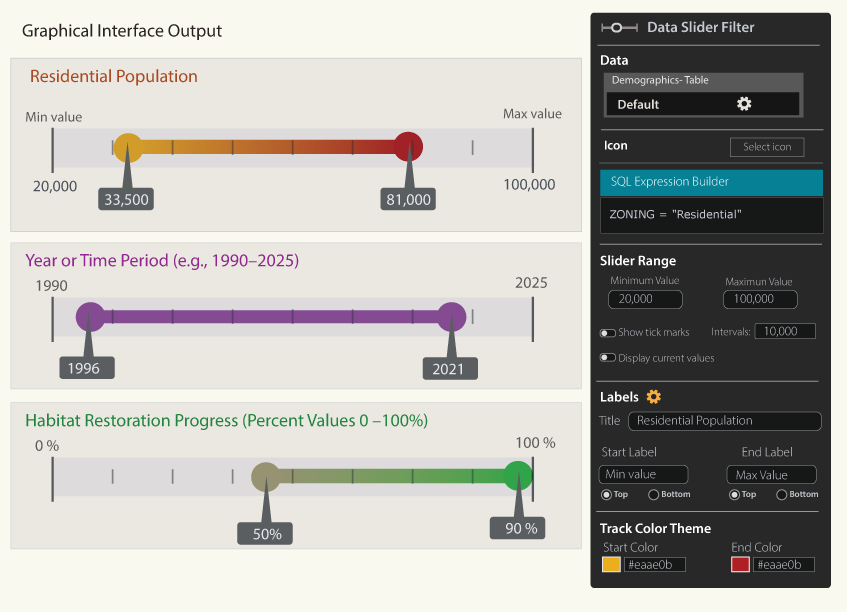
Example Use Cases Across Data Types
1. Percent Values (0–100%)
- Scenario: A conservation dashboard showing habitat restoration progress. Slider: 0% to 100% User Action: Drag to show only projects with 40–80% completion. Benefit: Quick comparison of progress without typing numeric values.
2. Year or Time Period (e.g., 1990–2025)
- Scenario: A historical dataset of wildfire occurrences. Slider: 1990 to 2025 User Action: Select 2005–2015 to analyze a specific decade. Benefit: More flexible than the Timeline widget when only year values exist (not full date fields).
3. Days or Duration Fields
- Scenario: Emergency response data with a “Days to Resolve” attribute. Slider: 0 to 60 days User Action: Filter incidents resolved within 10–20 days. Benefit: Ideal for operational dashboards and performance monitoring.
4. Numeric Ranges (e.g., population, elevation, cost)
- Scenario: A demographic dashboard showing census tracts by population density. Slider: 0 to 20,000 people per sq. mile User Action: Explore tracts between 5,000–12,000 density. Benefit: Supports exploratory analysis without complex filters.
5. Environmental Measurements (e.g., temperature, pH, turbidity)
- Scenario: Water quality monitoring application. Slider: pH 0–14 User Action: Show only samples with pH between 6.5–8.5. Benefit: Perfect for scientific datasets with continuous variables.
6. Financial or Economic Values
- Scenario: Real estate dashboard with property prices. Slider: $50,000 to $2,000,000 User Action: Select properties between $300k–$600k. Benefit: A familiar UI pattern for price filtering.