I have talked to @ChristopherAllen on this in the past but I guess I never made an idea.
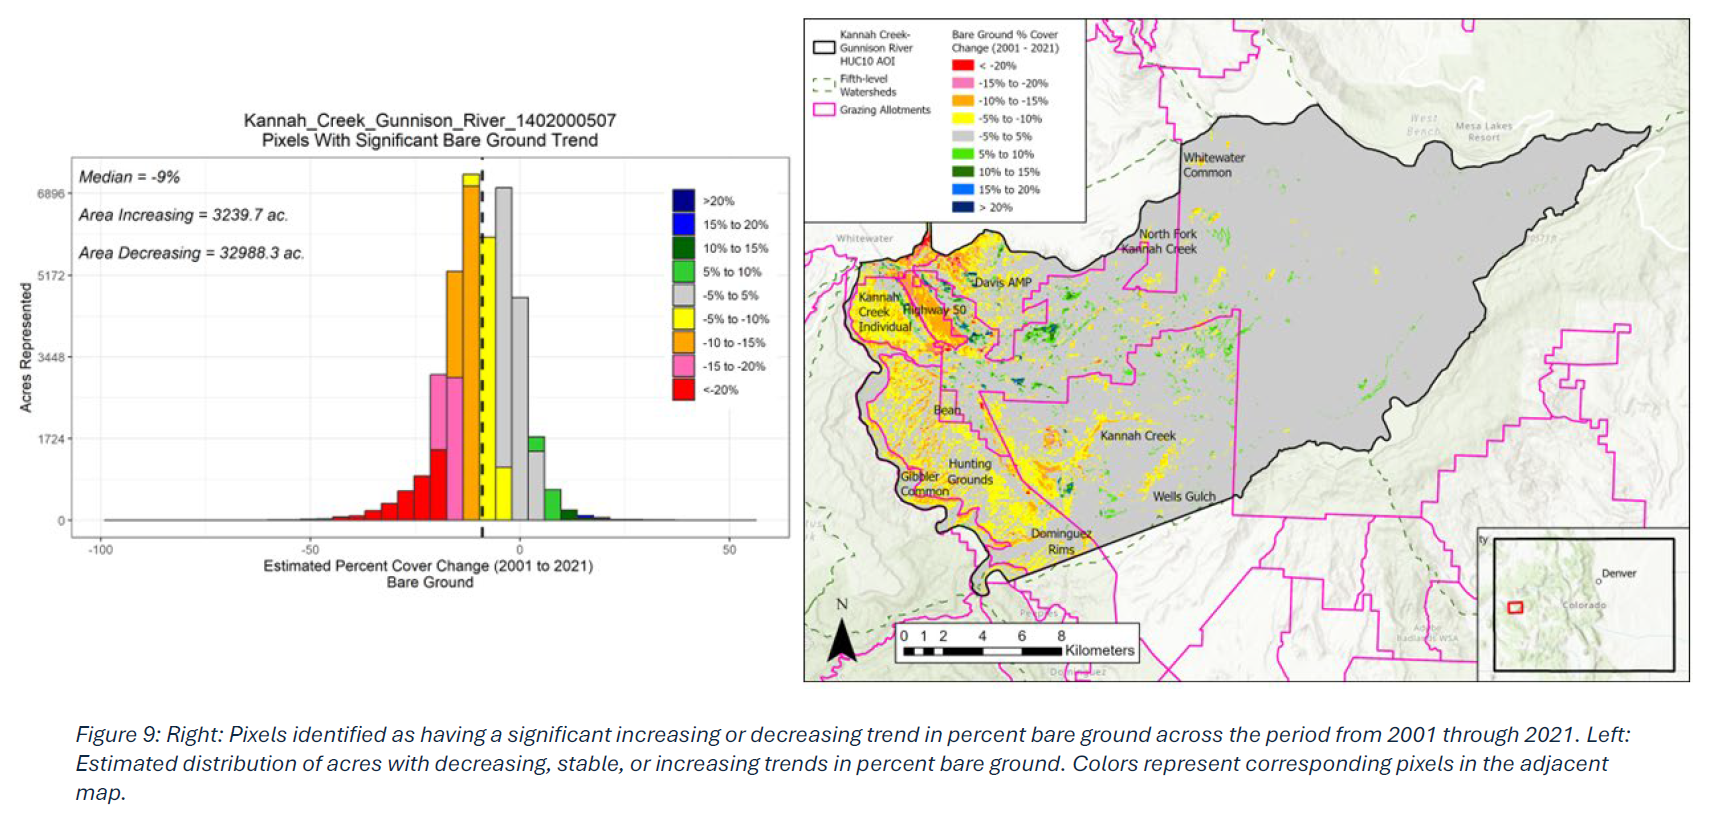
I would like to be able to match the colors in a histogram chart to the map symbology. Currently a histogram is all one color.
We have users doing this in R with ease. For now we are having to make the map in Pro and also do the histogram in R and it is a ton of work. I am really trying to get users from R to Pro but this one has been a big stopper for us. Pro has to keep up with R!
Example from R.
thanks a lot!