Hello,
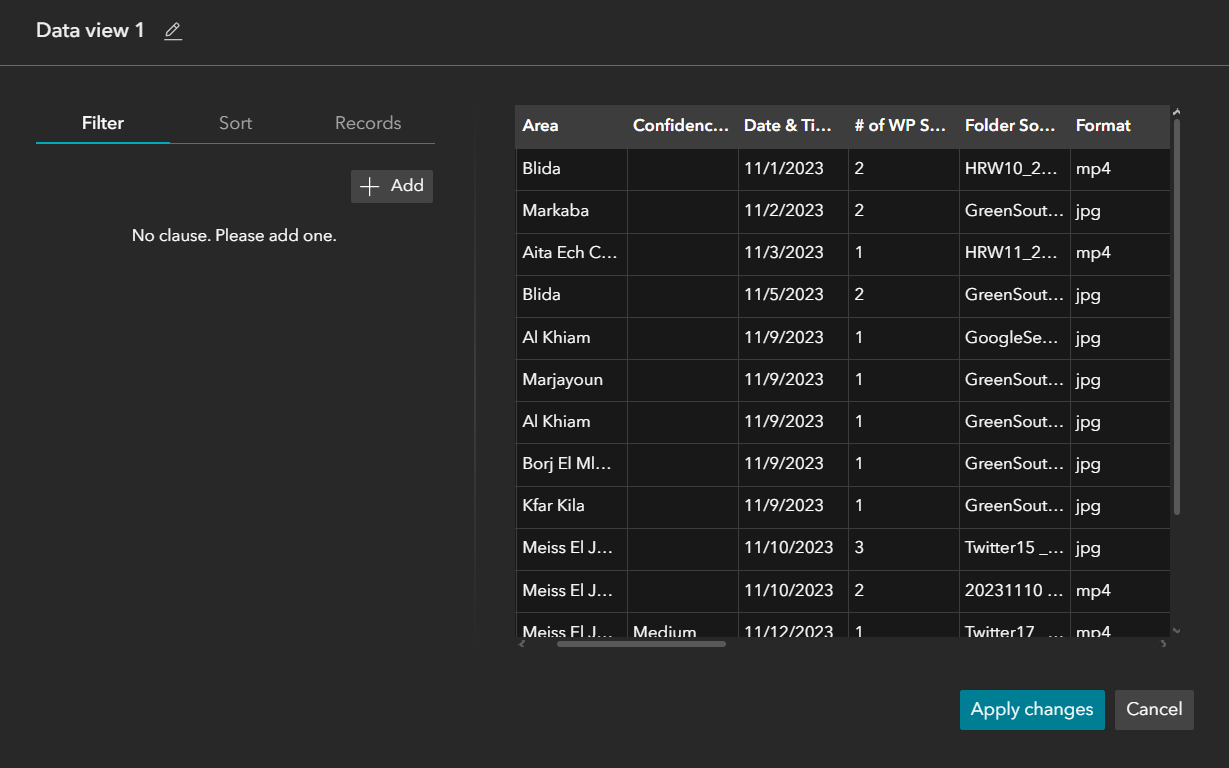
So i have a Web experience project with a feature layer containing incidents with their date & time, coordinates and other info. (Below is the table)
I want to create a chart that show the number of attacks on a daily basis. (Below is an example of the chart)
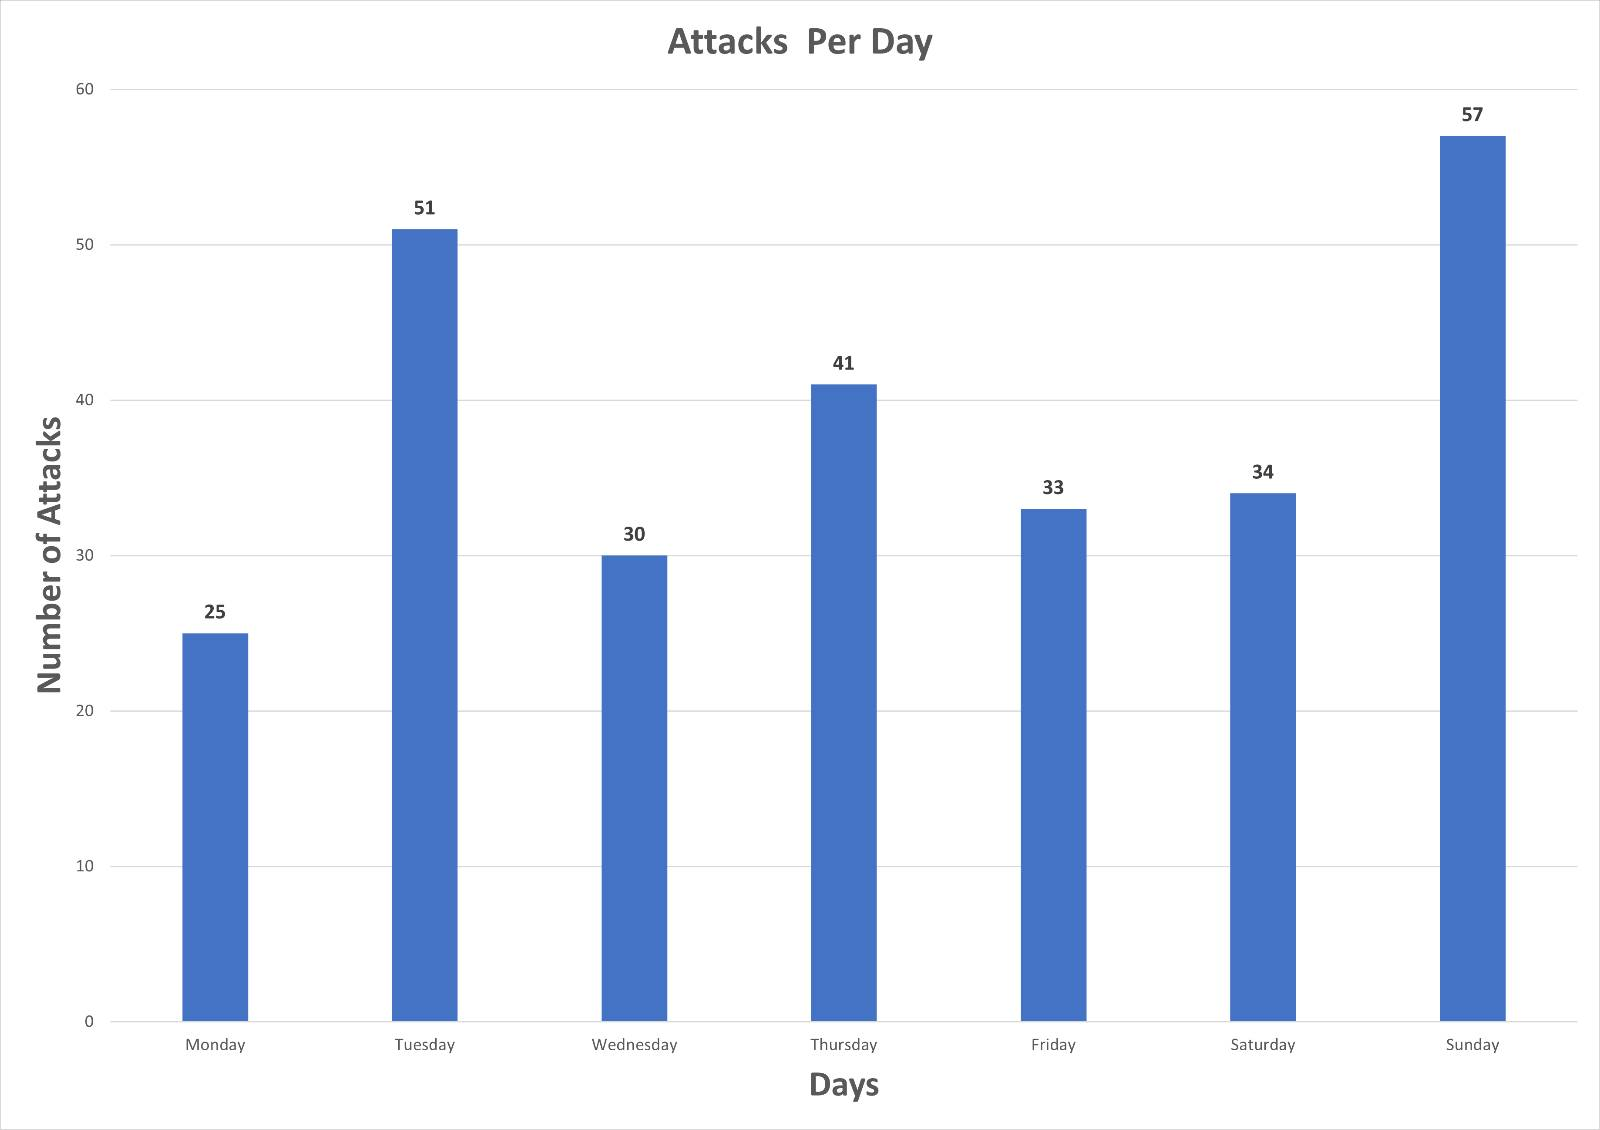
The trick is that i want this chart to also be linked with the main timeline slider that controls the map and other charts and information.
Is this possible in Web Experience? If yes, i would greatly appreciate your guys help.



