I'm using python to create bar charts and export them to SVG. This is no problem. The only issue I have is that I would like the top of each bar to display the value. If you create the bar chart manually in ArcGIS Pro, there is a little checkbox under Data Labels called Label bars.
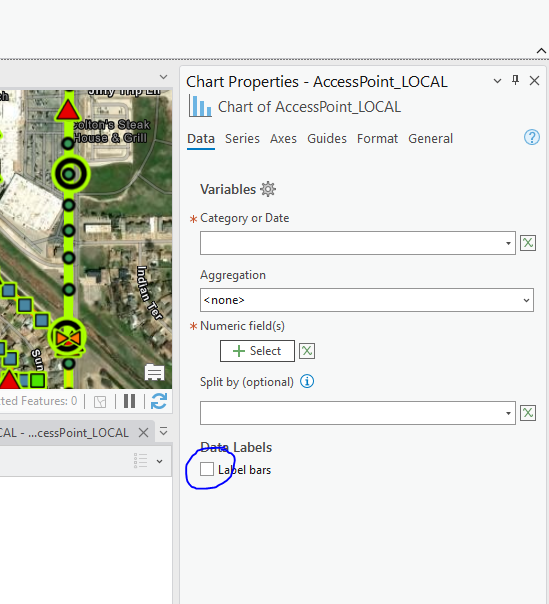
However, this does not seem to be exposed to Python. I tried this:
chart = arcpy.charts.Bar(x=count_field, y=count_field, aggregation='count', showDataLabels=True, dataSource=input_feature)
showDataLabels does not appear to be a valid parameter. I get this error:
TypeError: Bar.__init__() got an unexpected keyword argument 'showDataLabels'
showDataLabels works for Pie charts. So I want to verify that there is no way to enable these labels.

