I am trying to write a data expression that finds the count of that field. Then calculates the average of a field (filter/selection dependent) and use that in a bar chart along with the sum of another field.
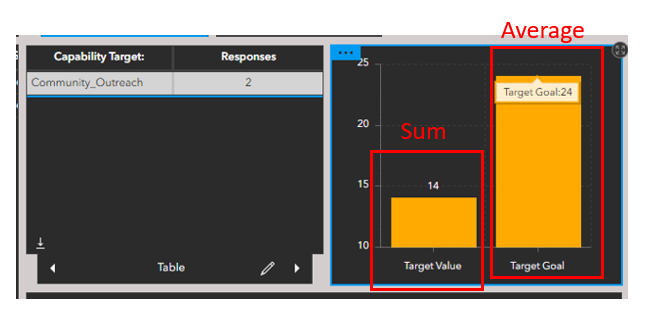
In the picture below, I am trying to get the Target Goal to be 12 (24/2 records) while the Target Value (14) is the sum of 2 values.
var fs = FeatureSetByPortalItem(
  Portal("https://www.arcgis.com/"),
  "384158f2ebe34f8ba8b0b39dfe5f5af5",
  0,
  [
    'Jurisdiction',
    'core_capability',
    'target',
    'target_goal',
    'target_value_final'],
  false
);

var tar_goal = $feature.target_goal

var tar_final = Filter(fs, "target_goal = @tar_goal")

//find the total count of tar_final
var tar_count =  Count(tar_final)

//find sum of target_goal
var goal_sum = Sum($feature, tar_goal)

//Divide the sum of target_goal by target goal count
var targets = goal_sum/tar_count

return targets@JohannesLindner

