I have a map of polygons (census districts in a city) and a chart on the right which displays the total population of the city classified by age groups. When it is idle, I would like to chart to display the total population of the city. However, when I select a specific polygon (a district in the city), I would like the chart to only show statistics of that district.
I feel that this is a simple question but I could not figure out how the action trigger should work. I have set a action trigger for my map ("record selection changes > framework > filter data records). In particular, I found that when I select "selected features" on the Chart's data, it will work but when I do not select anything on the map, nothing will show on the chart. On the other hand, when I set it to "Default", and when I select features on the map, statistics on the chart won't change (still showing the population of the city as a whole). To supplement, my chart use SUM of fields as statistics (I have a feeling that it might be relevant).

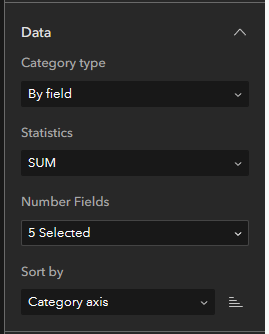
Very grateful for your help!



