Share your dashboard(s) to give each other some ideas as to what is possible. Along with that, post your pinch points where you are having difficulties.
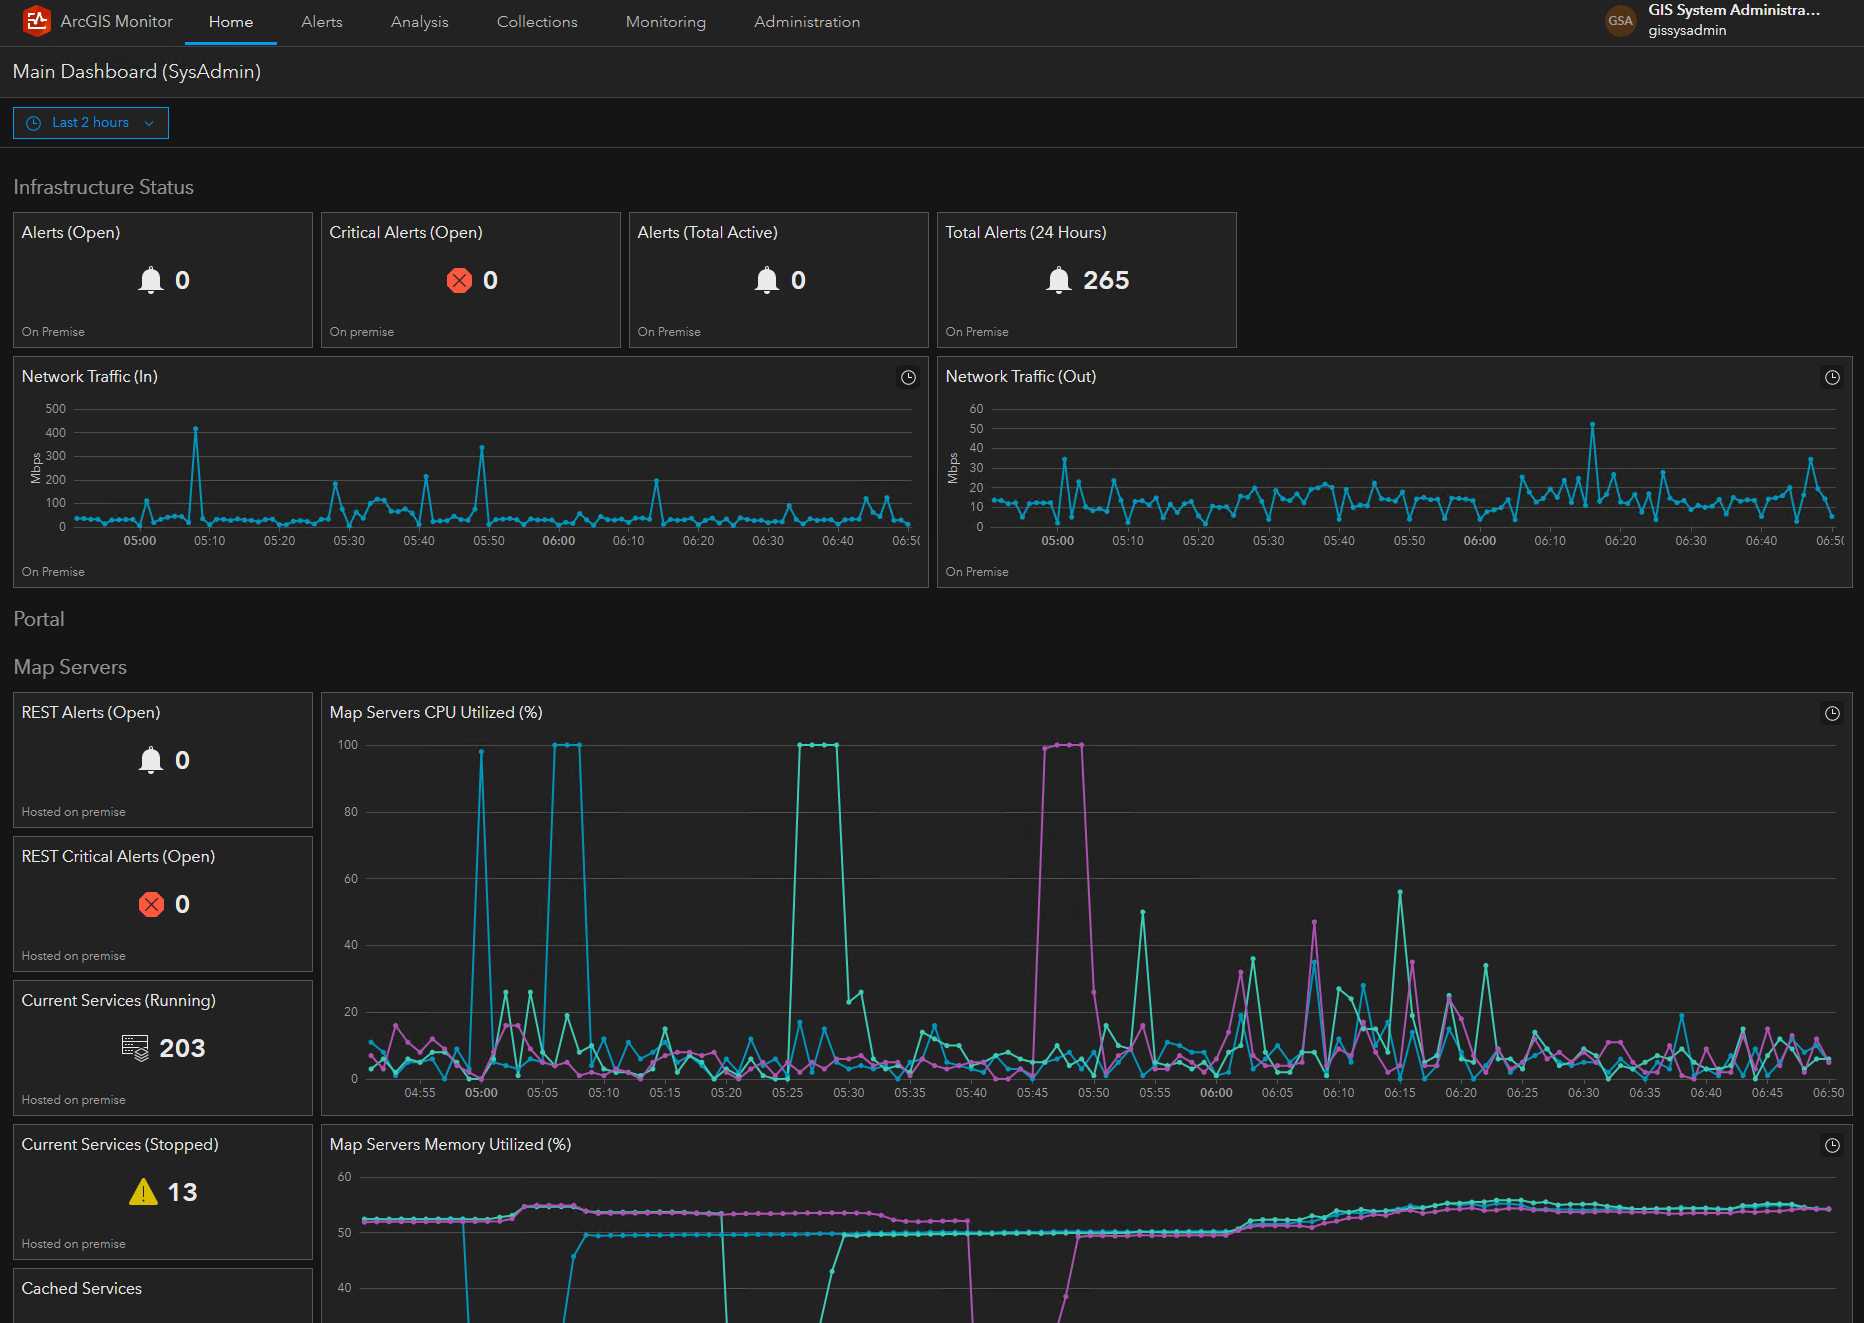
NOTE: If anyone needs to see how I put together some of my metrics, post a comment. Happy to share.
My specific pinch points are...
- You can monitor Portal, but it does not pick up the sub components (eg. Host, Datastores, etc.)
- You cannot monitor federated host servers if you have turned off the primary site administrator (PSA) as Host servers.
- Monitor thinks all servers are Host servers.
- It would be great if we could have some pre-built options to show Kbps vs. Mbps vs. Gbps or at least let us add in math for things like that.
- Some pre-built examples would be great so we have a patterns to look at, ie. for a host server you can get published service counts by doing X, for Portal you can get item counts by doing Y, etc..etc.
Outside of those couple of items, what an amazing improvement! Supremely happy with the results and am enjoying the rigors of putting together dumbed down dashboards for management to have eyes on with.
Value added item....if possible:
Could we make it possible to hook in ArcGIS Online only to pull things like Total numbers of users, Total number of items in the org, etc...etc. Perhaps even being able to monitor the RSS feed for issues would be great. Having 1 system that can monitor the entire Enterprise would be supremely helpful.