The goal is to take to the results of the above expression and use populate a pie chart using ArcGIS Online Map Viewer Classic, Popup, Arcade Expression and pie chart. So if one clicks on any Census tract, they would see standard pop up attributes and pie chart showing the higher 6 spoken languages.
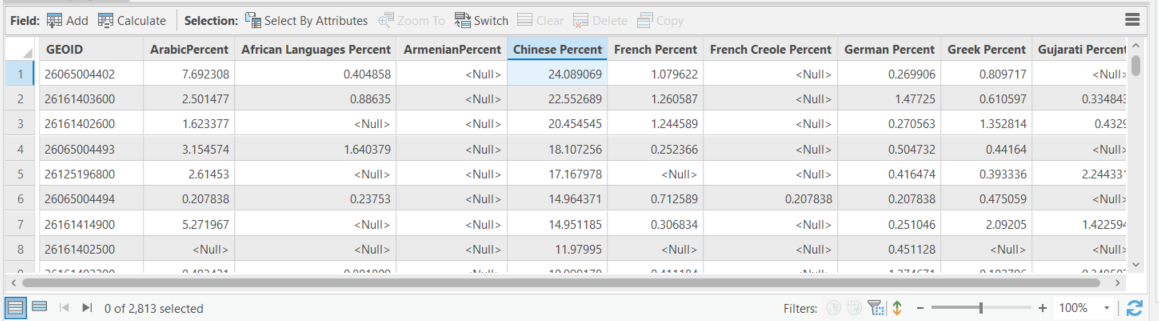
See example of the Census tract data with 9 of the 40 languages
Thanks
John Esch

