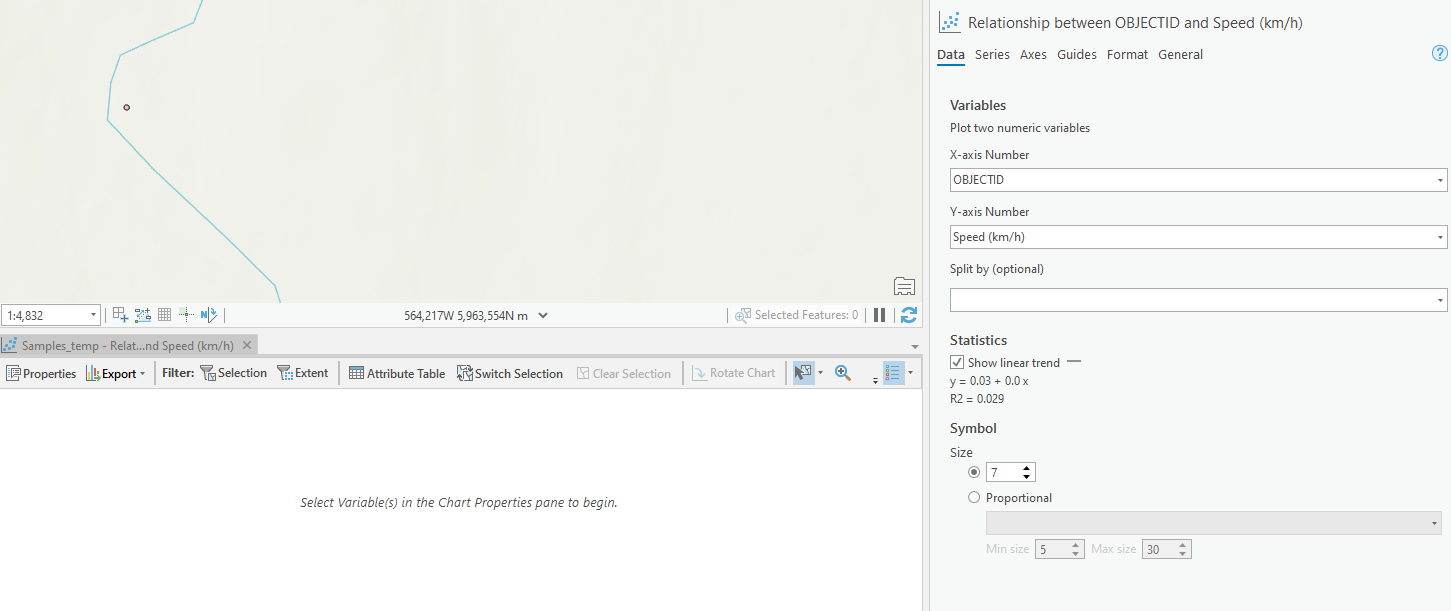
I have a point layer which will not load a chart and I cannot understand why. Despite selecting the chart variables the chart panel continues to display the message "Select Variables in the Chart Properties pane to begin".
I have tried:
- Seveal different chart types (bar, scatter plot, histogram etc.)
- Saving the layer locally (originally it was a hosted layer on AGOL
- Deleting all but a couple of features from the layer
- Creating a new map and adding the layer
- Filter by Extent & Selection
- Restarting Arcgis Pro
I can't figure out what the problem might be. It seems like the chart is being created (e.g. the chart title and axis labels are all configure and the linear trend equation chages when I chose a different variable) but is just not visible.