Hello,
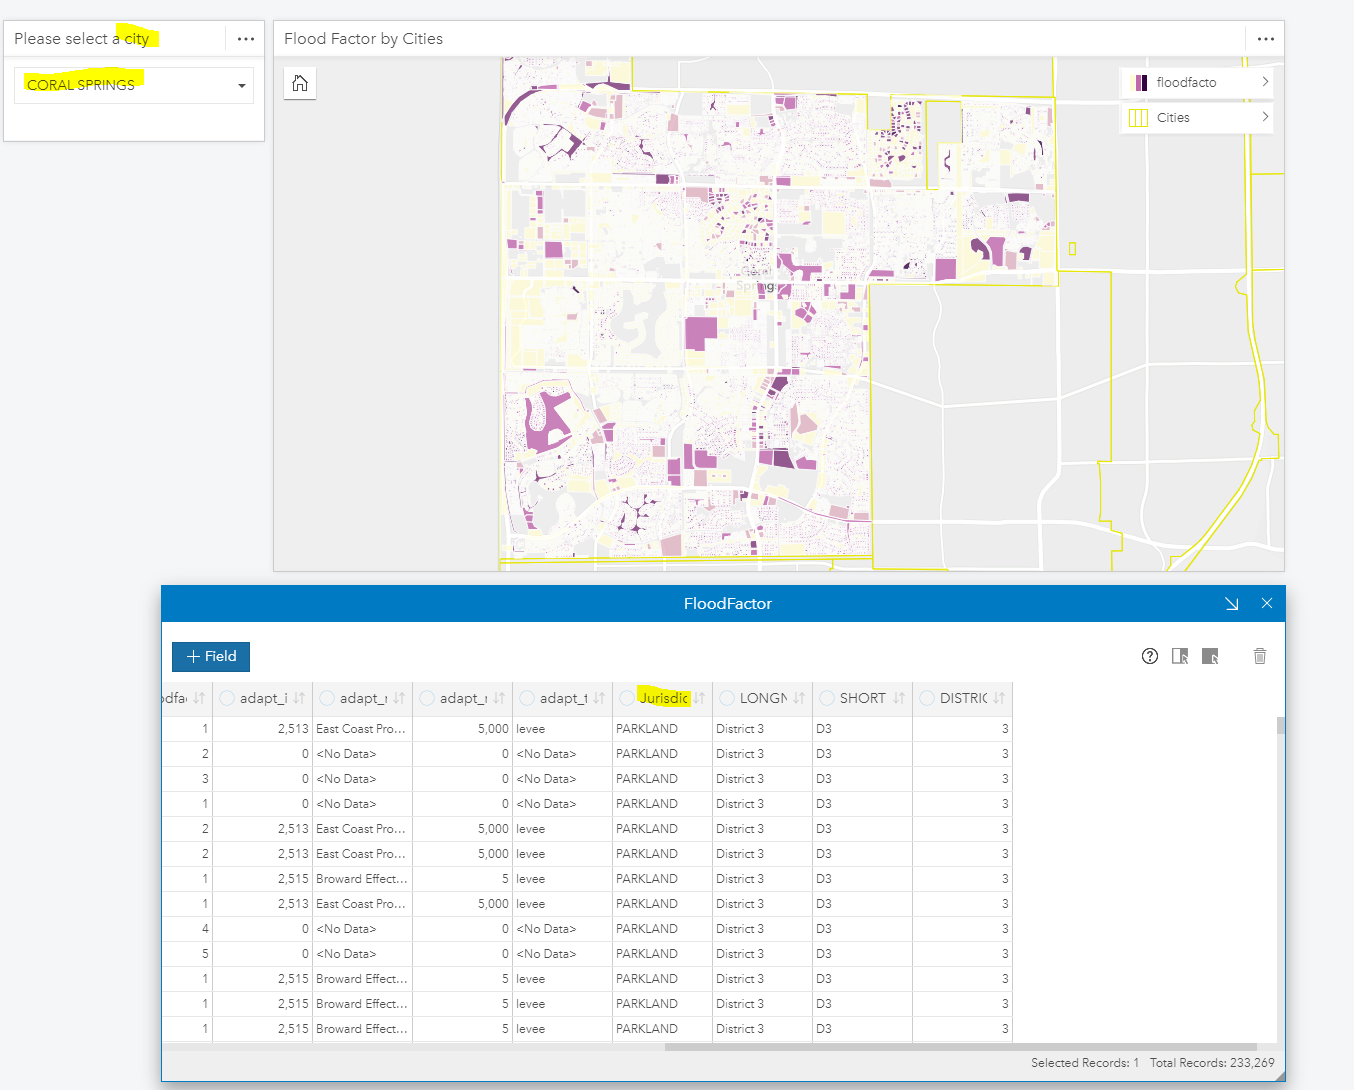
I am trying to create an Insights Desktop app which has the capability to filter plots and tables by using the `predefined filters` card. The drop down menu filter does work on the visuals but I can't seem to connect the filters to the data table.
In the example below, I have selected the city of Coral Springs (under `jurisdict` column), and the map is showing the results just for that city. Now, I also want the table to filter accordingly to show the results just for Coral Spring, so that the map and table are both in sync.
Please note that the plot, drop down menu and the table were created using the same dataset.
How can I do this in Insights Desktop?