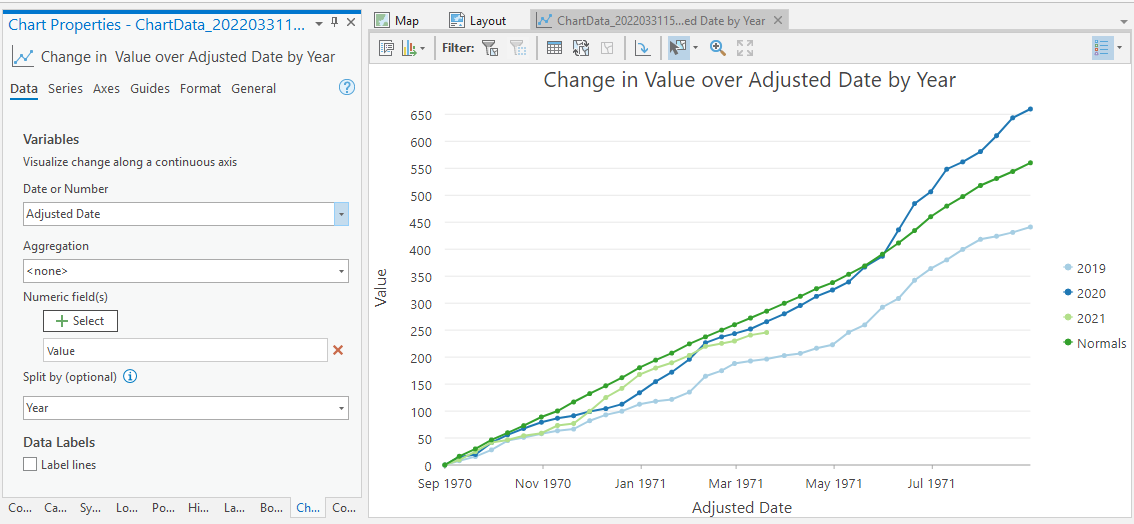
Multi-year line-series charts are important to the group I work for. In Desktop, these kinds of graphs could be created since the option was there to use another attribute for the labeling along a given axis (i.e., use a numerical or date field to plot the data, but label it with human-friendly text). In Pro, as you can see in the attached example, I can create a line-series chart and use a date field for the x-axis. I'm stuck, however, with the date format provided, and I don't see a way to change it. With Arcade, python, Pro SDK, etc. ... I'd work with anything if there's a way. Thank you, cg.