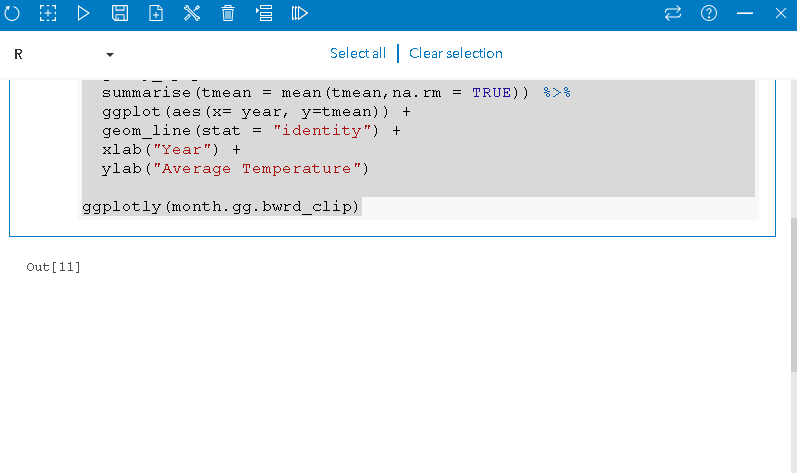
Hello, I am trying to create a simple "plotly" timeseries plot in Insights Desktop. But I am getting a blank output for some reason.
How can I fix this?
Code
library(tidyverse)

library(plotly)

# Import the air temperature dataset to create a plotly plot.
df = read.csv("O:/local_path.csv")

# Plot
month.gg.bwrd_clip = df %>%
#Calculating mean by year
group_by(year) %>%
summarise(tmean = mean(tmean,na.rm = TRUE)) %>%
ggplot(aes(x= year, y=tmean)) +
geom_line(stat = "identity") +
xlab("Year") +
ylab("Average Temperature")

ggplotly(month.gg.bwrd_clip)