When using esri/toolbars/draw in versions of the JavaScript API starting at 3.31 there is an extra graphic added to the map when using the arrow, circle, triangle, and ellipse tools. It appears in the center of the graphic, where you click to start creating the graphic. When you zoom in or out, these graphics locations are not adjusted and if you are trying to add your graphics to a GraphicsLayer they are not removed when the layer is cleared even through the final graphic is. The graphics I am talking about appear in red in this image:
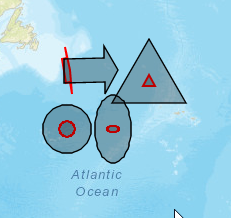
You can see this with the draw toolbar sample (https://developers.arcgis.com/javascript/3/sandbox/sandbox.html?sample=toolbar_draw). If you bump the version in the sample back to 3.30, this issue goes away so it seems like a bug in the API. Is there a workaround to prevent these graphics from being created?