Hello
is it possible to add a chart to a webmap (new webmap) popup using an Arcade featureSet? I have a feature layer with a related table (1-M) and I would like to be able to use a bar chart to show data from previous years.
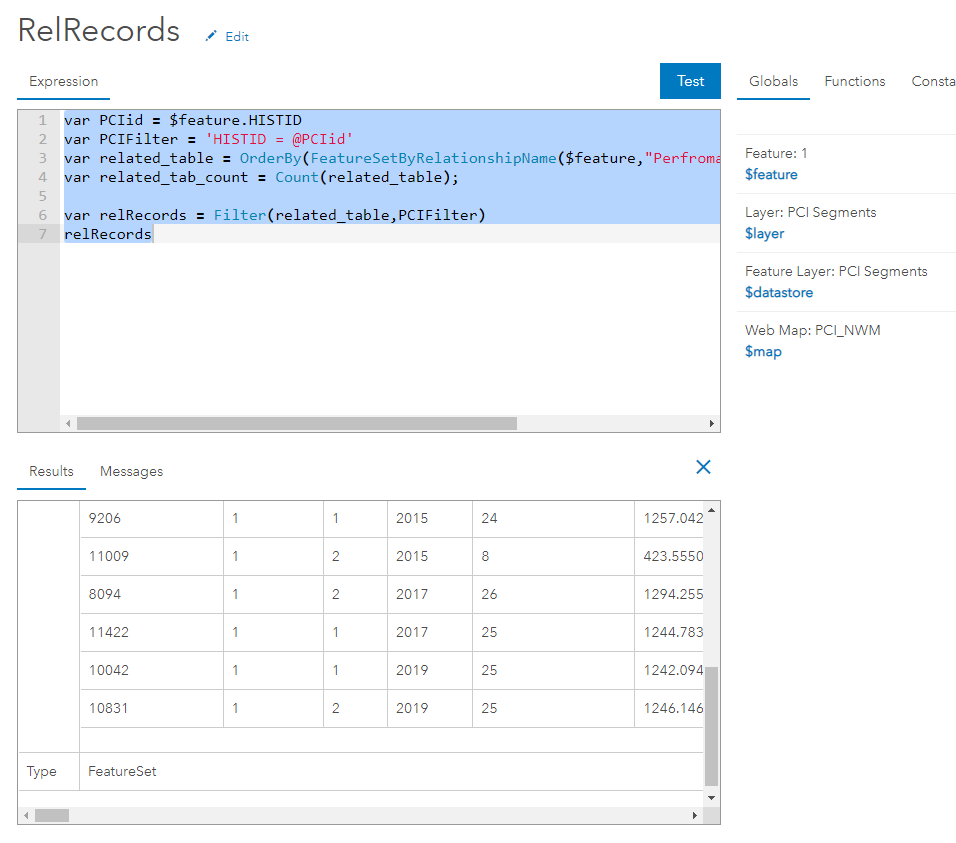
The arcade expression returns the featureSet as expected (see image below)... can it be done?
Thanks!