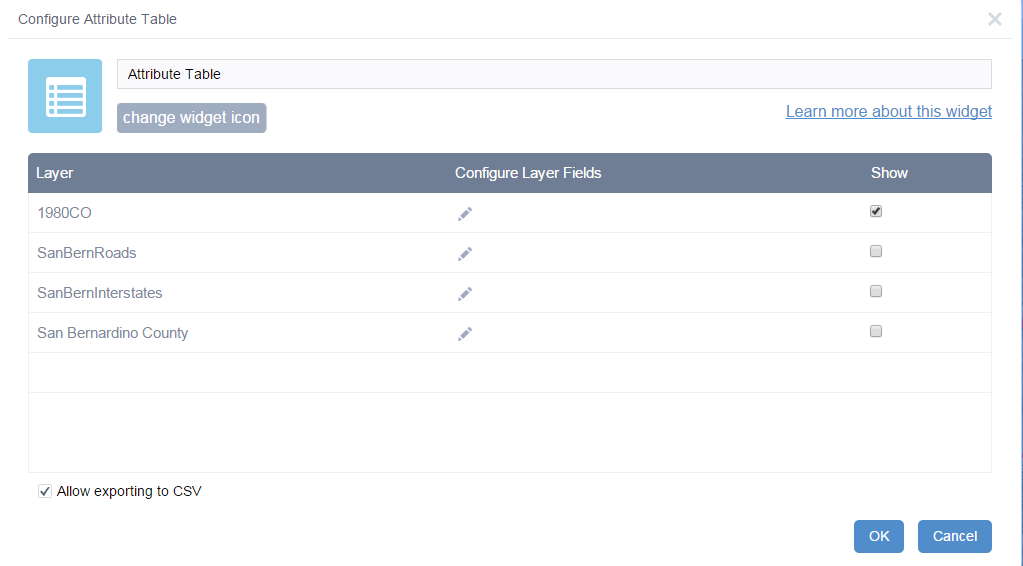
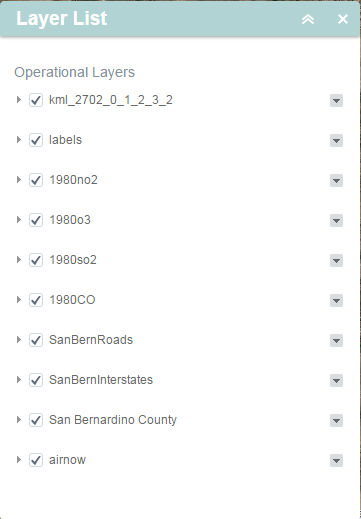
I am still working with the EPA data, but I have moved on to making a web app displaying current AQI from AirNow, and conditions from 1980 (the earliest collection in my study area, San Bernardino, CA) I have the EPA data for CO, SO2, NO2, and O3 symbolized by the AQI standards for harm/safety. In the web app however, I can only get 1980CO to show up in the attribute table widget. I would like for all 4 attribute table to be displayed, but can't figure out what's wrong. I would love some suggestions on how I can get the attribute tables to display.
Thanks,
Faith


