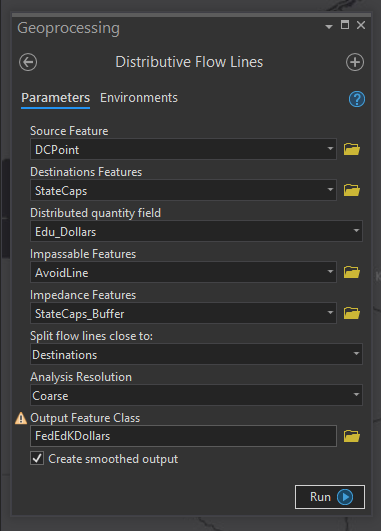
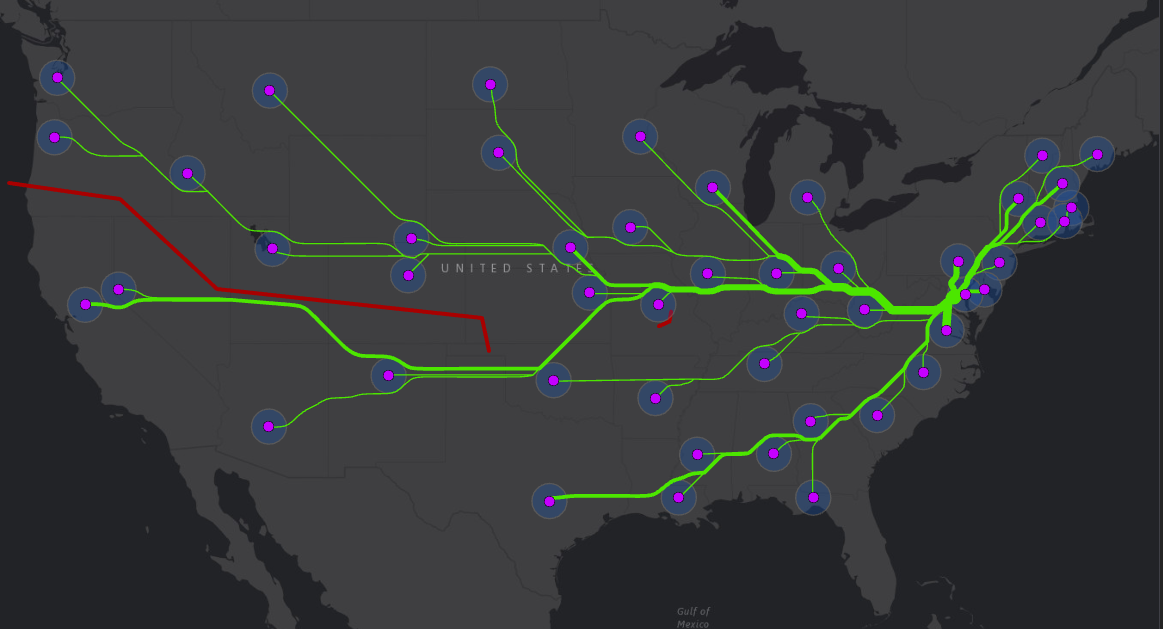
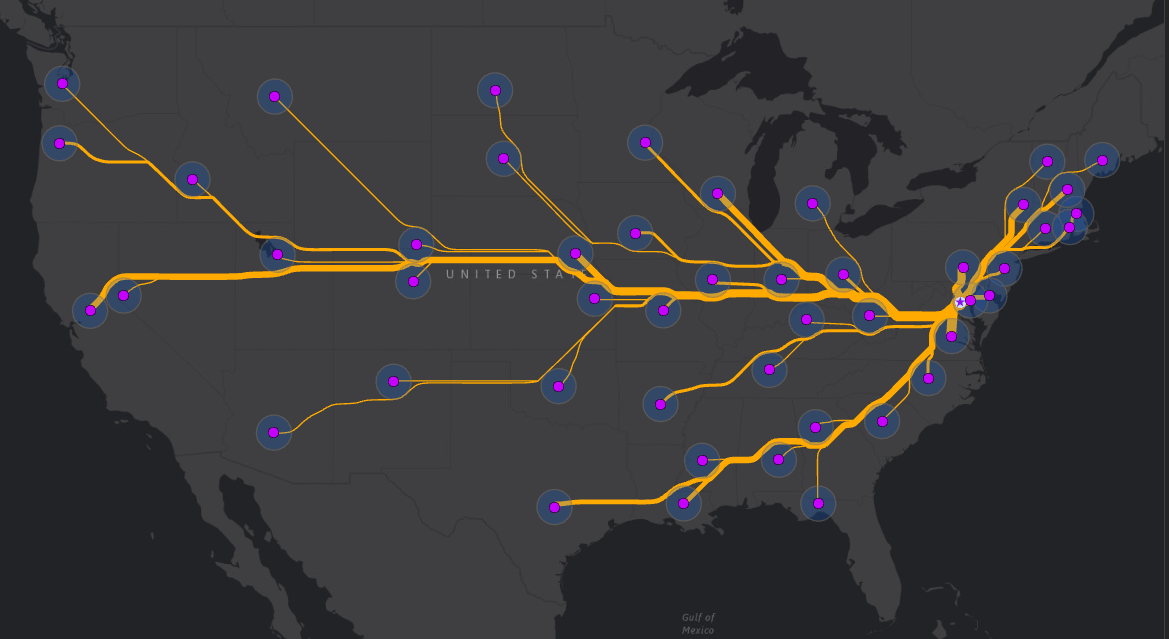
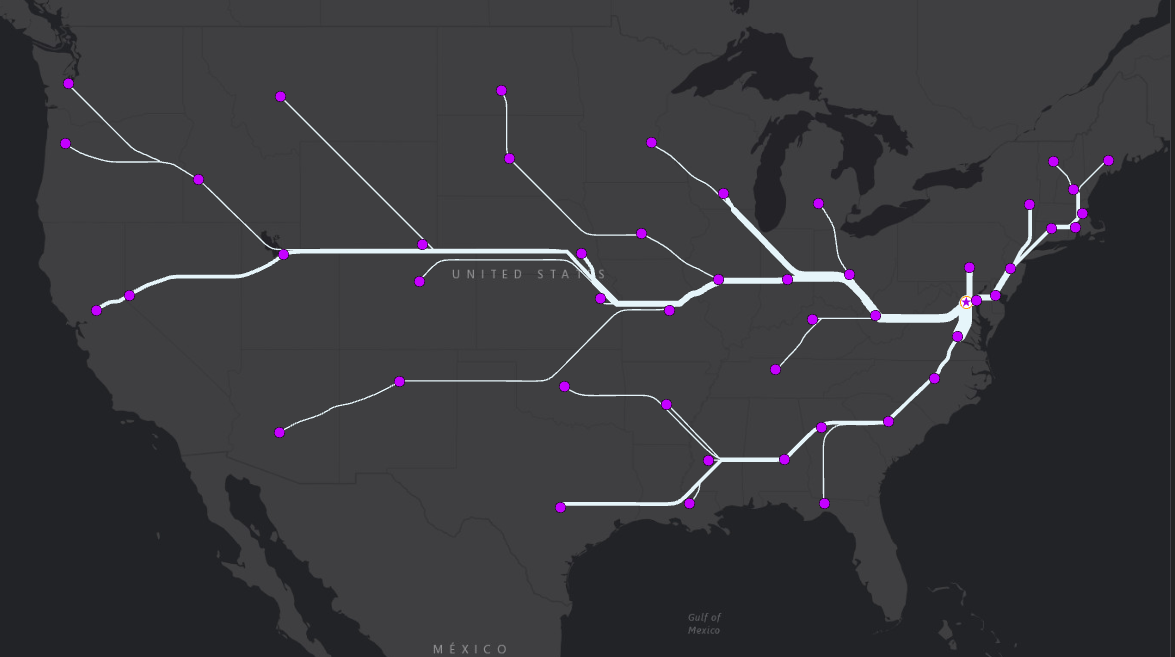
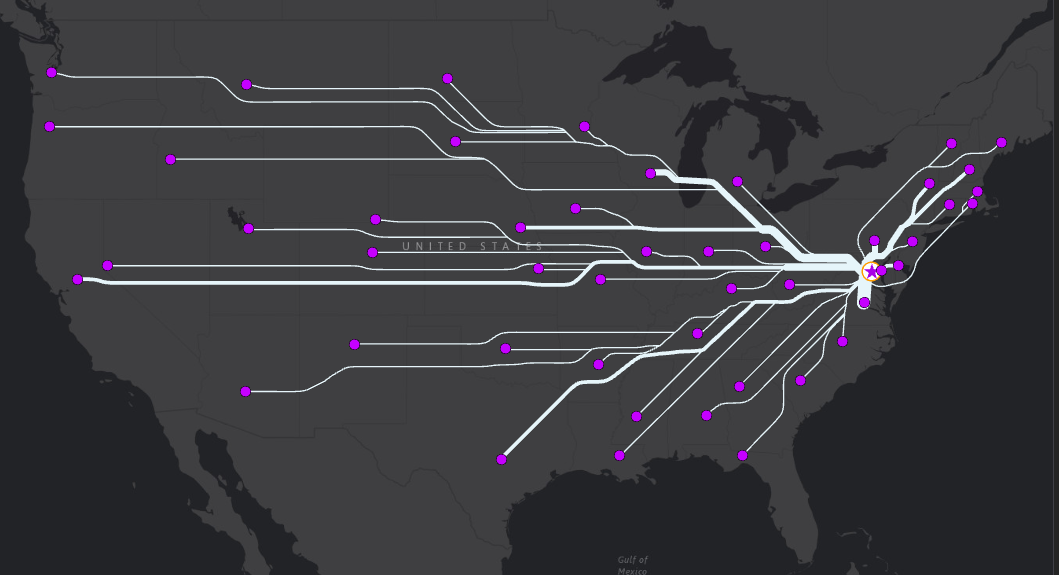
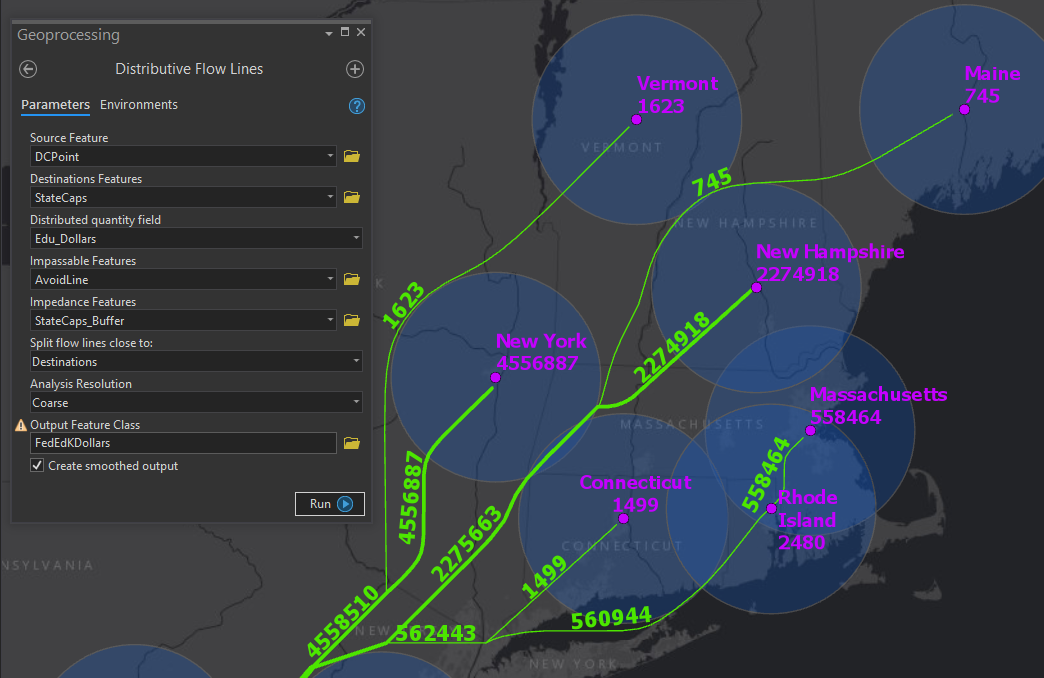
新しいバージョンの Distributive Flow Lines<\/STRONG>(DFL)ツールが利用可能になりました。(2022年12月15日) ArcGIS Pro 3.0との互換性が更新されました。いくつかの機能強化とコードのクリーンアップが行われました。 このツールは現在、新しいDistance Accumulationツールを使用しています。 ArcMapでツールを使用したい場合は、以前のバージョンのDFLと以前のブログもまだ利用可能です。 以前のブログには分配フローマップの背景やツールの内部動作に関する詳細も含まれています。 ここでは新しいProツールの使い方と入力およびフロー「方向」に関するいくつかの詳細に焦点を当てます。 このブログの例は、ワシントンD.C.から下位48州の州都への連邦教育税金の流れを示しています。 一緒に試したい場合は、このブログで使用されたツールとテストデータが上記最初のリンクから入手可能です。 <\/P>注意: ツールを使用するにはArcGIS ProとSpatial Analystエクステンションが必要です。 Spatial Analystライセンスにアクセスできない場合は、Esri Marketplaceから30日間無料トライアルを取得できます。 このツールはBasicベースライセンスレベルで動作します。 ツール内で利用可能なCreate smoothed outputオプションを使用したい場合は、StandardまたはAdvancedベースライセンスが必要です。<\/P>通常、フローマップは単一のソースから多くの目的地への何かの流れを描写します。また、多くの目的地から単一のソースへの流れも示せます。 DFLツールは両方の場合に使用可能です。 インターフェース内では収束点をSource Featureと呼びます。 裏側では「何か」は常にDestinationsからSourceへ流れます。 これはツールがArcGIS hydrology GPツールを使用しており、フローラインは最大の流れがSourceノードで終わる小川ネットワークに似ているためです。 Source Featureはフローラインが終端する場所であり、ネットワークを流れる「何か」を説明する特定のフィールドを持つ必要はありません。<\/P><\/P>図1:新しいDistributive Flow Linesツール<\/EM><\/SPAN><\/P> <\/P>図1のDestination Featuresには、Sourceから受け取る「物」の量を示す整数フィールドが必要です。 図1では、Source FeatureであるDC PointはワシントンD.C.上のポイントフィーチャーです。 StateCapsは下位48州の州都を表します。 Edu_DollarsはStateCapsフィーチャークラス内のフィールドで、州に供給される連邦教育税金を表します。以下の図2は図1の入力に基づいて生成された出力です。<\/P><\/P>図2:図1入力値に基づく出力。カリフォルニアとネバダは赤い障壁を避けて南向きに流れる。<\/EM><\/SPAN><\/P>注意: ツール出力ラインは自動的にSingle Symbolスタイルでマップに追加されます。 出力ラインを太さが増すように表示するにはSymbologyペインでシンボル設定を変更する必要があります。 出力フィーチャーにはDestination featuresから入力されたDistributed quantityフィールドと同じ名前のフィールドが含まれます。このフィールドをシンボロジーフィールドとして使用してください。さらにSymbologyペイン内でMethod、Classes、Minimum size、Maximum size、およびTemplate入力パラメーターを調整して好みの効果を得ることができます。<\/P>以前のDFLバージョンでは、オプション入力であるImpassable FeaturesとImpedance Featuresが似ているため混乱がありましたが、ツールによって異なる扱いがされています。両方ともフローライン配置場所に対する制御を提供します。図2では米国西部半分にある大きな赤線がImpassable Features入力です。州都周辺の青いバッファーはImpedance Features入力です。Impassable featuresはフローラインによって横断または接触されません。わずかにバッファーされてラインはそれらを回避して流れます。Impedance Featuresはフローラインによって横断されることがありますが、多くの場合他により「コスト」が低い経路がない限りこれらも回避されます。図3はImpassable Features指定なしの場合の出力です。カリフォルニアとネバダから北向きへの変化に注目してください。<\/P><\/P>図3:Impedance Features入力指定だがImpassable Feature入力なし。この場合フローラインは中間州都周辺を回避して流れる傾向になる。<\/EM><\/SPAN><\/P>ヒント: ImpedanceおよびImpassible featuresをマップ上でオンにしたり追加したりする必要はありません。ここでは明確化のため表示しています。このツール適用例によってはストーリー伝達上重要なため表示したい場合もありますが、多くの場合美観目的で出力形状制御だけに使われストーリーとは無関係です。<\/P>以下図4ではImpassableもImpedanceも指定されていません。ご覧の通りフローラインは中間州都を通過します。この場合望ましいこともありますが連邦税金の場合、中間州を通過しないため混乱するかもしれません。Impedance feature指定でこの混乱を減らせます。また州都周辺バッファーをImpassable Featuresとして指定するとフローラインは州から離れて流れられず解決策不可能になります。<\/P><\/P>図4:ImpassableまたはImpedance Features指定なしで生成された出力。カリフォルニアとネバダは北向きに流れる。フローラインは中間州都を通過する<\/EM><\/SPAN><\/P> <\/P>以下図5では図4と同じ入力ですが、「Split flow lines close to」パラメーターのみDestinationからSourceへ変更しました。その結果カリフォルニアからミズーリまで専用ラインができ、北東部でもいくつか変化があります。この見た目はあまり美しくないかもしれませんがどの州がより多く税金を受け取るか強調する効果があります。<\/P><\/P>図5:Split flow lines close to Destinations、ImpedanceおよびImpassable features未指定<\/EM><\/SPAN><\/P> <\/P>図6は北東部拡大図です。注目点はいくつかあります。一つ目はImpedance FeaturesであるStateCaps_Bufferへの扱いです。ニューヨークおよびコネチカットバッファー内をフローラインが通過していることに注目してください。この理由は直接ルートがこれらバッファー回避より「コスト」が低いためです。紫色ラベルはフローライン上値の由来箇所を示し、緑色ラベルは個々支流フローライン合流時加算的性質を強調しています。そしてマサチューセッツ州フローラインがロードアイランド内を直接通過していますがこれはロードアイランドStateCaps_Buffer内に位置しているためです。この場合マサチューセッツ税金がロードアイランド経由しないこと明確化するため手動編集が必要になるかもしれません。<\/P><\/P>図6:ニューヨーク・コネチカット・ロードアイランド周辺バッファー内通過するフローライン、および加算的性質にも注目してください<\/EM><\/SPAN><\/P> <\/P>このツールがフローマップやその他創造的な用途作成に役立つことを願っています。またコメントや提案、利用事例も楽しみにしています。このブログで紹介したツールとサンプルデータへのリンクはこちらです: Distributive Flow Lines for Pro.<\/A><\/P>
What a powerful tool for visualizing flow. Thank you for working so hard on this!
Well done, amazing work!I would like to use my tool for a given area, but I am getting no results. I've set everything up as recommended and yet the tool doesn't return any layer.Area of intereset: Europe,Projected coordinate system: ESPG 3857
I get the following message:
LOG:Foreground cost raster created!Source Feature processedDestination features processedNOTE: "If script completes with no output make sure destination feature is within the processing extent"
I compared this message with the message from your sample and it seems the script didn't take a few steps.
Thanks in advance for help!Bartosz
Bartosz
The behavior you are seeing is usually due the fact that there are not connections possible between the source and destinations. This may be caused by use of barrier features that obstruct the path between the source feature and destinations. It may also be caused by projection issues but I believe the code checks for that situation.
Let me know if this suggestion does not help you get things working and we can keep troubleshooting.
Best
Bob
Hi Bob, Thanks for allowing to use this excellent tool. Is there any way the tool can be modified to allow the flow to happen along specified lines/paths (and the direction to be controlled by the slope of the lines/paths)? Currently, I guess one can have some control over the lines by putting several lines under Impassable Features. Thanks for your help! Best, Mo
Mo
If I understand your question, you might be able to directly use the Hydrology tools in Spatial Analyst. Those are the same tools I use in the DFL tool to create flowlines. There are a number of tools in Pro for creating surfaces which is what you need as input to the Flow Accumulation tool and then eventually the Stream To Feature tool. Topo to Raster would provide a way to use the existing lines as input to the surface creation process. Create TIN, Edit TIN, and Raster to TIN are tools that may also help. If your features do not represent a conventional streams but you want things to flow to them you can use Euclidean Distance or Distance Accumulation or Cost Distance to create an "artificial" surface that gains elevation as it moves away from your existing lines. This surface can than be used as input to the Hydrology tools. The general workflow would be something like 1. Distance Accumulation based on distance from existing lines, 2. Flow Direction, 3. Flow Accumulation using output from Flow direction. 4. Stream to Feature. Distance Accumulation and Euclidean Distance both provide for an optional Direction output so you could skip the Flow Direction step above. Here is a much description of the process I outline above.
Hope this helps, Bob
Hello!
I have downloaded this tool and have been tinkering with it and I can't get it to work. I am trying to show the flow of refugees from various countries (source feature class) into the US (destination feature class). Both of these parameters are met with this:
"ERROR 000001 Traceback (most recent call last):File "<string>", line 130, in updateParametersAttributeError: module 'arcpy' has no attribute 'mapping'"
Do you have any tips? My professor has never used this tool.
Thank you
Maren
I believe what might be happening is that you have opened the ArcMap version of the tool but are trying to use the tool in ArcGIS Pro. This link: https://geoxc.maps.arcgis.com/home/item.html?id=46a5ce17daa146e29aa60bc3535d3833 will get you to the version of the tool that will work with ArcGIS Pro.
Please let me know if this does not resolve your issue.
Thanks
You are right! I did download the wrong one. Thank you.
Now I am having issues with the distributed quantity field. I do not have the option to select the refugee totals per country from the drop down. Only the "FID" number. I don't know if it matters, but I keyed in the refugee numbers myself to the attribute table.
The distributed quantity field needs to be an integer field. (Long or Short). This sounds like an interesting project. The refugee field is already an integer field you can reach out directly to me at bgerlt@esri.com. It has been a while since I published the tool so it may need an update.
Best,
Hi Bob;
Thanks for providing the tool but it apparently doesn't work with a Basic license. Is there a way to change the tool to allow it to work at that license level? Thanks.
Jim
Hi Bob, @BobGerlt
i am running the latest version of arcgis pro (3.03), after running the flow line generator with youre basic settings, the lines are drawn on the map, but the thickness of the lines is the same for every line and no circles are drawn around the cities, any ideas how to fix that?
Thanks for the tool!
greetings Nate
Nate, @nathandb
Thanks for using the tool and for your comments. In paragraph 5 above, I attempt to explain how to use Impedance features. If you would like to have the lines "mostly" avoid the cities then you need to create buffers around them and specify those buffers as input "Impedance" features. As Impedance features the lines will generally avoid the buffers but in some cases, where a less costly path is unavailable, the lines will pass through the buffers as in the Northeast section of the US example. If you make the buffers "Impassable" then you will make those features unreachable and so a solution will not be possible. Generally "Impassable" features should not directly correspond to Source or Destinations but might be used to control the location of output lines. For instance the US boundary LINES between Mexico and Canada could be used as "Impassable" feature to prevent lines passing through those countries. This might happen if you included Alaska as part of the input.
Your question about the thickness of the lines caused me to reread the blog and realize I did not explain how to get the thicker lines as the distributive quantity increases. I think I must have covered it in a previous blog or in the tool comments but not in this version. To make the lines increase in width you must symbolize the lines using the Graduated or Proportional line symbols in the Symbology pane, use the distributed quantity field, e.g. Tax dollars or People, as the symbolization Field. Adjust the number of Classes, break Method, Template, Minimum and Maximum to get the line sizes you prefer.
Watch for some edits to the blog as well as a new version of the tool coming soon.
Any news on the availability of the tool at the Basic license level? Does it require the Spatial Statistics extension? Thanks.
Jim, @JimWooten
I hope to make time to post an update to the tool this week. At that point I will also check the minimum license level required to verify if it more than Basic with Spatial Analyst extension.
The tool should not require the Spatial Statistics extension but it will require the Spatial Analyst extension.
Thank you!
@JimWooten
I have updated the tool to be a bit more compatible with ArcGIS Pro 3.0. The tool will run with only a Basic ArcGIS Pro base license and a Spatial Analyst extension. If you choose to use the Create smoothed output option then a Standard or Advanced base license will be required in addition to the Spatial Analyst extension.
I look forward to feedback and comments.
Great, Bob, thanks. I'll work with the tool and let you know how it goes.
Hi
i am getting this error when running the tool:
ERROR 001041: At least one densification parameter must be specified.
please help
Dede
I will need a bit more info to help... could you send me a screenshot of the tool with the parameters you used to run it? You can send it directly to me at bgerlt@esri.com. If you are using Impassable features it may be that you have created a situation where your Impassable features prevent any valid paths between between the many Destination Features and the single Source Feature.
@BobGerlt
Thank you for your work on this, I am using ArcGIS Pro 3.1. Does it work in 3.1? I am getting an error "More than one feature in Source feature class. Only one feature is allowed in Source feature class." Any chance you could provide the data table for the example above?
Thanks in advance!
I am excited to explore this tool! Can the results of the PRO analysis be sent to AGOL as a layer?
Yes, The output will be a feature class that you can then publish to AGOL
Hi Bob,
I have downloaded the tool and have been using it for the past week. I plan on using the results in a Dashboard where I would like to have the flowlines turn on/of dynamically when certain geographies are selected (i.e. counties, and zip codes, etc.).
However, I've noticed that when generating the flow lines from a zip code centroid point layer, there is now way to tie the flow lines back to their zip code centroid point feature class. Is there a way to have an OID field or perhaps a field a user can specify to carry over into the flow lines result? This would be extremely helpful as it would allow for correlation back to the Destination point layer.
Thanks for your help and great work on this tool!
Does the tool work with ArcGIS Pro 3.2? I am running it with all necessary parameters filled, no errors appear and there is a message saying the tool has run successfully, however, no output layer is created.
Best regards,
Yana
Hi,
My Distributive Flow Map tool does not produce an output.
I am trying to create flow map of tribes migrating between winter and summer pastures (Megelgin) but it does not produce any lines and the operation takes 3 seconds. I attached the screenshot.
Interestingly, destination feature class created by my advisor does not have this problem. I attached screenshot of it as well.
Something is preventing Spatial analysis in my case, returns null or something but I cannot figure out.
Thanks,
I have an issue with Distributive Flow lines and ArcGIS Pro 3.3! The code doesn’t finish; it gets stuck during the data cleanup phase and never complete. However, the output file is still generated in the catalog.
サインインしたメンバーは投稿、更新のフォローなどができます。初めてですか?無料アカウントを登録してください。
Find useful guides, FAQs, and documents to help you navigate and make the most of Esri Community.