私は明らかに同形異義語を理解していません<\/P><\/DIV>Part Iで書いたように、Chrome Developer Toolsへのアクセスはショートカットキー(Control + Shift + I)を使うか、ブラウザ右上のハンバーガーメニューをクリックし、「More Tools」から「Developer tools」を選択することで簡単に行えます。Developer Toolsが開くと(他のブラウザにも別のDeveloper Toolsがあります)、いくつかのタブが利用可能になります。ここではConsoleに焦点を当てます。Chrome Developer Toolsで直接Consoleタブを開くには、このキーボードショートカットを使います:Control + Shift + J(「J」はjocularの意味です)。さらに便利なヒントについては、公式Googleドキュメントの
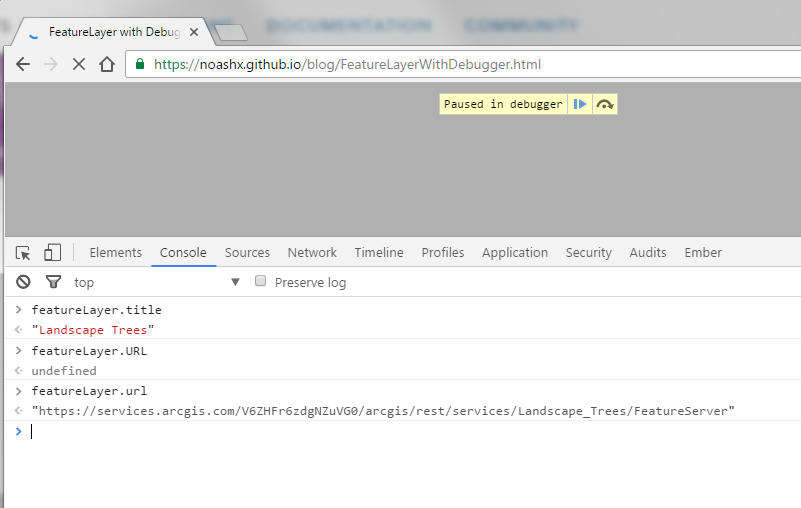
JavaScript console.log ステートメント<\/P><\/DIV>以下は「console.log」ステートメントの出力スクリーンショットです。期待した関連情報が表示されています。また、「featureLayer.URL」の出力が「undefined」であることにも注意してください。これはコンソール内の項目が大文字小文字を区別するためです。有効なプロパティは「featureLater.url」であり、無効なプロパティはエラーを投げずundefined結果を返します。この問題は捕捉が難しいですが、このブログ後半で対処法について説明します。
console.logからのJavaScriptコンソール出力<\/P><\/DIV>Consoleが開いたまま、コード内と同じプロパティ値を入力してみましょう:
featureLayer.title<\/STRONG>featureLayer.URL<\/STRONG>featureLayer.url<\/STRONG><\/P>これらすべてのプロパティが実際の値(または「undefined」さえも)ではなくエラーを返すことに注意してください。これはアプリ初期化後にローカル変数がスコープ外になるため、「featureLayer」オブジェクトさえ認識されなくなるためです。 以下は新しいコンソールステートメント出力のスクリーンショットです。
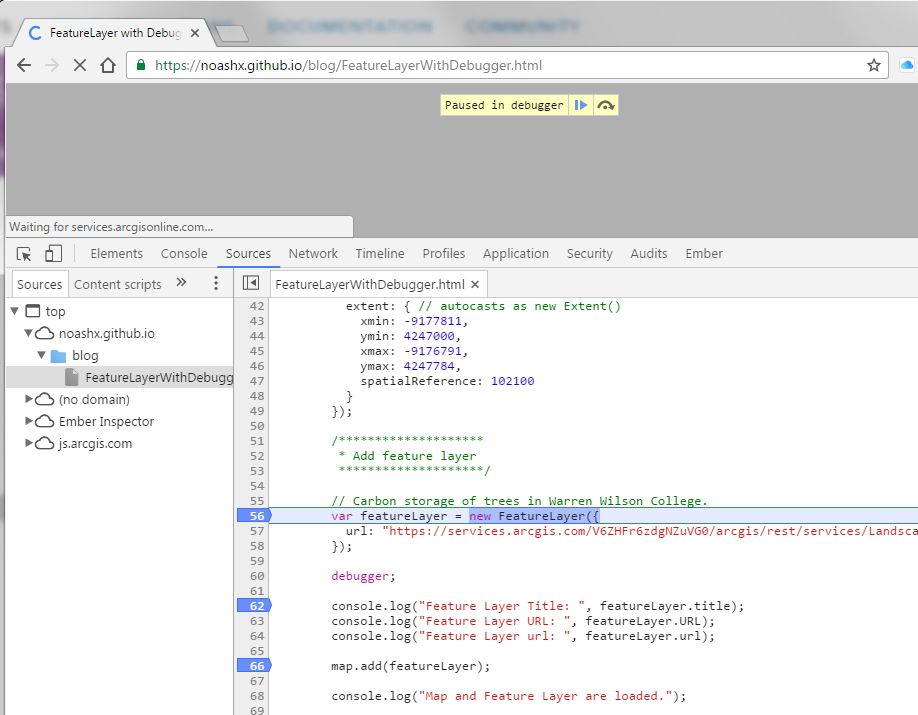
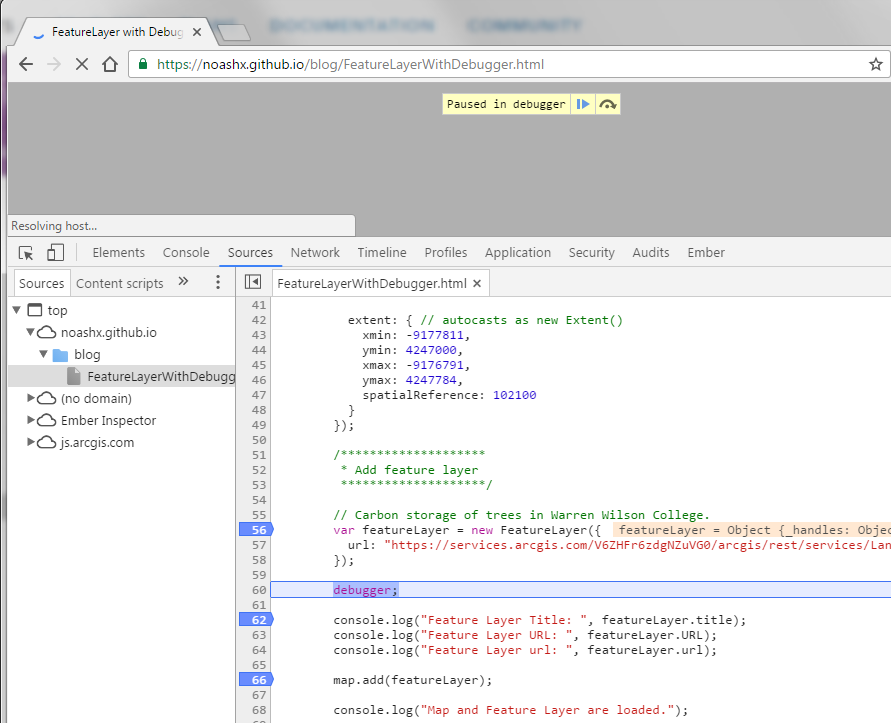
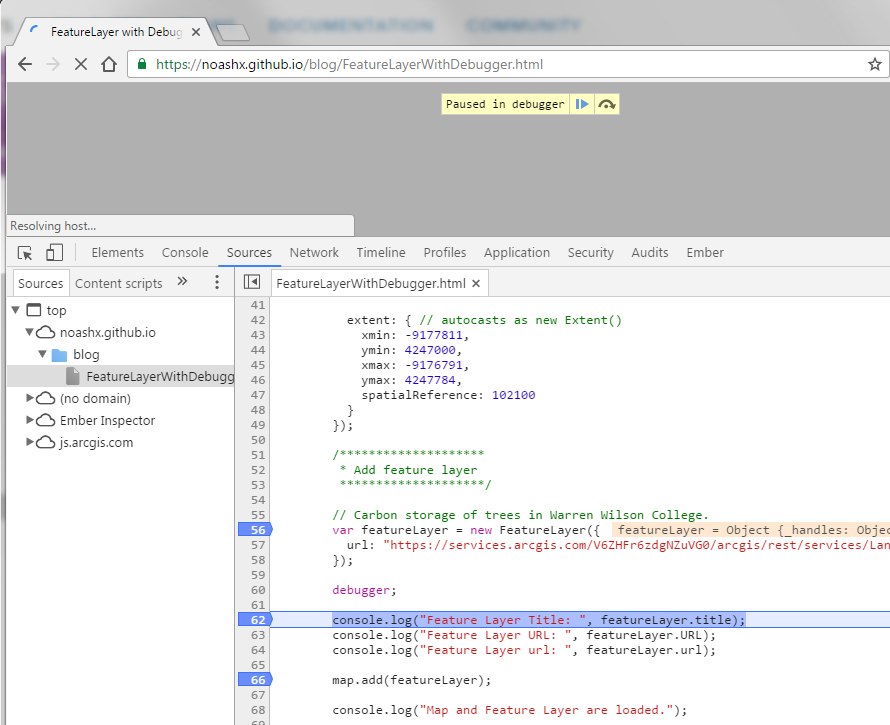
アプリロード後のJavaScriptコンソール出力<\/P><\/DIV>もし「featureLayer」をグローバル変数にしていたら、コンソールではオブジェクトに対して「undefined」が返されていたでしょう(変数は認識されるが詳細にはアクセスできない)。ポイントは:スコープ内にある変数だけがコンソールで調査可能ということです。それではコンソールを対話的に使ってプロパティ値を入力できますか?試してみましょう。次にサンプルアプリに追加できることはコード内への「debugger;」ステートメント追加です。GitHubでホストされている別の修正済みサンプルはこちら:
Here is a blog I wrote that is along the same lines of teaching techniques on how to approach web development:
How to customize a web app using JavaScript, the DOM, Chrome DevTools, and Chrome's debuggerBlog Post created by Andres Castillo on Jul 24, 2019https://community.esri.com/people/andrescastillo08/blog/2019/07/24/how-to-customize-an-app-using-javascript-the-dom-chrome-devtools-and-chromes-debugger
Whohoo! Noah, that's awesome. Thanks for sharing, somehow I missed the third installment! Keep going.i
Well buckle-up Arne, because "JavaScript Debugging Tips Part III" dropped a few months after this blog was published, so if you've only read parts 1 & 2, you're in luck:
https://community.esri.com/groups/technical-support/blog/2017/06/14/javascript-debugging-tips-part-iii-advanced-google-chrome-developer-tools-tips
Thanks for writing Part 2. But it's been 2 years again. This should be a monthly installment thing. Following the API documentation and samples is great. But what I struggle with most is debugging. Chrome Dev Tools documentation helps. But tailoring some documentation to the ArcGIS JSAPI developer, especially the "accidental developer" type would be a terrific resources. ESRI's got such savvy folks...Please keep going!
サインインしたメンバーは投稿、更新のフォローなどができます。初めてですか?無料アカウントを登録してください。
Find useful guides, FAQs, and documents to help you navigate and make the most of Esri Community.