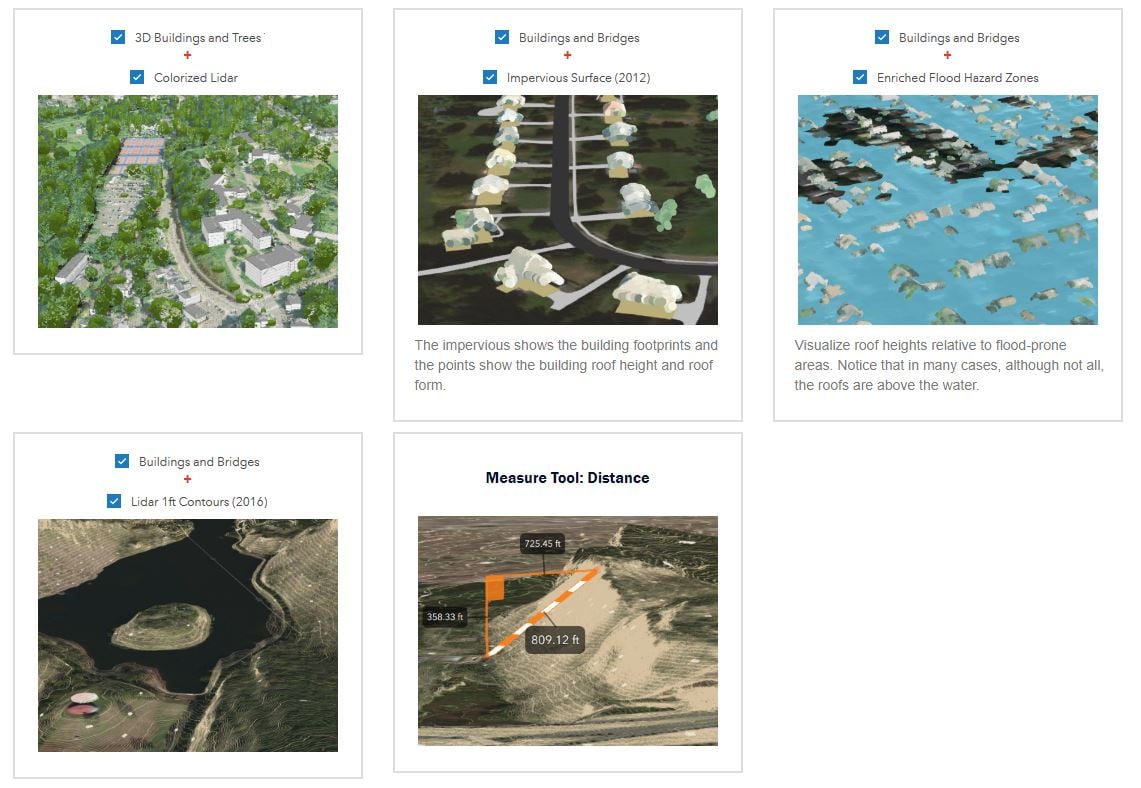
このブログは発展途上で、始まったばかりであり、時間とともに成長していきます:<\/STRONG><\/P><\/P>ここ数年、私は3D Basemapソリューションを使用し、lidarから建物を抽出して作成したSt. Louisエリア<\/A>のような3D都市の補足として、色付けされたlidarポイントクラウドを公開してきました。Sean Morrishはlidarの公開メカニズムについて素晴らしいブログ<\/A>を書いています。最近では、色付けされたlidarポイントクラウドを効果的かつ比較的安価な方法で3D Basemapを作成する手段として検討しています。多くの州、郡、市町村がすでにlidarを利用可能であり、多くは高解像度の画像を持ち、すべてがこれらのシーンを作成するために必要なNAIP画像を持っているという利点があります。<\/P><\/P>Mantiowoc Countyのlidarシーン:<\/STRONG><\/P>一部の郡、市町村、州はすでにこれを実施しています。ウィスコンシン州Manitowoc Countyには3D LiDARポイントクラウド<\/A>があり、そのデータでシーン<\/A>も作成しています。Manitowoc Countyはまた、色付けされたlidarポイントクラウドとしてのlidarの利用方法を示す素晴らしいストーリーマップも作成しました。<\/SPAN>こちら<\/A>でぜひご覧になることを強くお勧めします。. <\/SPAN><\/P><\/A><\/P>このストーリーマップは動画で、郡全体の任意の場所でLiDAR地表面の垂直距離、水平方向距離、および直接距離を取得する方法を示しています。また、小さなLiDAR地表面特徴(例えば道路への溝の深さ)の詳細な測定方法も説明しています。<\/P><\/P>家屋の屋根を例にして、LiDAR地表面に対するLiDARポイントクラウドの距離を測定し、建物の高さを見ることができます。<\/P><\/P>こちらはManitowac Buildingsシーンレイヤーの一つで、同じ色付けされたlidarを使って建物側面を偽装するという創造的なアイデアがありました。これは建物として分類されたlidarを複数回表示し、それぞれシンボロジーのオフセットを変えてわずかに低い標高にすることで実現しています。このブログの後半でその方法を紹介します。<\/P>
<\/P>
Mantiowoc Countyのlidarシーン:<\/STRONG><\/P>一部の郡、市町村、州はすでにこれを実施しています。ウィスコンシン州Manitowoc Countyには
このストーリーマップは動画で、郡全体の任意の場所でLiDAR地表面の垂直距離、水平方向距離、および直接距離を取得する方法を示しています。また、小さなLiDAR地表面特徴(例えば道路への溝の深さ)の詳細な測定方法も説明しています。<\/P>
家屋の屋根を例にして、LiDAR地表面に対するLiDARポイントクラウドの距離を測定し、建物の高さを見ることができます。<\/P>
こちらはManitowac Buildingsシーンレイヤーの一つで、同じ色付けされたlidarを使って建物側面を偽装するという創造的なアイデアがありました。これは建物として分類されたlidarを複数回表示し、それぞれシンボロジーのオフセットを変えてわずかに低い標高にすることで実現しています。このブログの後半でその方法を紹介します。<\/P>
退職前にこれらすべてをまとめたManitowoc CountyのBruce Riesterer氏に敬意を表します。彼は建物ポイントを複数回異なる色で使用して建物側面を示すアイデアも考案しました。現在は民間企業で働いており、新しい作品は
lazファイルへのリンクや画像、DEMその他レイヤーへのリンクが含まれるフィーチャクラスも追加されました。これによりユーザーはダウンロード前に3Dビューアでlidarをプレビューできるようになりました。また、多くのユーザーが事前に閲覧できるよう線や面による測定も可能です。<\/>.
葉あり高解像度:<\/SPAN><\/SPAN><\/P><\/SPAN><\/P>葉ありNAIP:<\/SPAN><\/P><\/SPAN><\/P>葉なし高解像度:<\/SPAN><\/P><\/SPAN><\/P>時には、葉が落ちる前のカラフルな秋の画像がシーンに最適な場合もありますが、何を見せたいかによります。<\/SPAN><\/P><\/P>枝と葉としてポイントで木を追加する方法:<\/STRONG><\/P>これはDead Treeシンボロジーを使って幹と枝を表現し、葉はライダーのカラー化されたポイントから取ったテストです。 私のツールTrees from Lidarや3D Basemap Solutionのツリーツールはライダーから木を作成し、その後ポイントをDead Treeシンボルで表現できます。 この画像はArcGIS Proで作成されており、シーンではありません。<\/P><\/P><\/P>City of Klaipėda 3D viewer (Lithuania):<\/STRONG><\/P>リトアニアの
以下はケンタッキー州の支援で行った作業です。その結果は点描画法(Pointillism)という絵画技法を開拓したneo-ImpressionistsのGeorges SeuratとPaul Signacの作品といくつか似ています。<\/P>
Kentucky lidar colorized:<\/P>
壁の錯覚を追加し、屋根を厚くした状態(カンバーランド、KY):<\/P>
建物の側面を示す別のビューはこちら:<\/P>
これは建物の側面の錯覚であり、色は実際の建物の側面と一致せず、使用されたlidarの強度の違いは上記の窓のように見える真の違いを示していません。 ほとんどの錯覚や表現と同様に、それは目を騙して建物の側面だと思わせます。 時には、多くの錯覚や表現と同様に、この建物がポイント数が少ないためにすべての角度からうまく機能しないこともあります:<\/P>
全体として、代表的な側面は何が建物で何でないかを識別するのに役立つと思います。 建物の側面の色は現実とは一致せず、真の窓や真のドアも示しません。 それを行うには通常、建物の3Dモデルを生成した後に非常にコストがかかり時間もかかるプロセスです。 それでもLocal Government 3D Basemap Solution for ArcGIS Proで3D建物を生成し、それらを半透明にして着色なしで選択や分析に使用することができます。 また、rpksを建物に適用して3Dモデルをより正確に表現することもできますが、これも非常に詳細なデータなしでの表現となります。 <\/P>
広範囲向けLidar取得方法:<\/STRONG> こちらは
Colorized Lidar Point Clouds の基本、シーンレイヤーパッケージ作成と可視化について:<\/STRONG><\p>こちらは
Hi! Interesting blog. I noticed you have Barnegat Bay Scene Viewer listed under the examples of some colorized lidar to look at. Barnegat Bay is in New Jersey, for those who are curious!
Hi Trish, thanks for the comment. I added the location to it.
Arthur
Hi Arthur - really interesting blog.
I have a question that is semi-related to your blog entry -- more specifically related to your #3 step towards the end of the blog: 3. Looked at the projection in the reports in the meta data downloaded and found it was not supported because it used meters instead of feet, modified a projection and then copied it using a simple model builder tool to give a projection file to each LAS file.
When you say "modified a projection", what exactly are you doing in ArcGIS Pro? I have a las file with a known projection and vertical coordinate system (NAD 1983 (2011) UTM Zone 18N, NAVD88 height - Geoid12A (metres)) but when I generate the las dataset it floats above the surface. This suggests to me that I have in an incorrect vertical reference so I'm trying to figure out how to modify the projection or reproject the lasd to get the stars to align.
See below.
Any thoughts?
Hello John,
What I did was saw the vertical projection in meters, but the one list was in feet. Here's the text in that projection file: USGS_LPC_CA_Wildfires_B1_2018_w1927n1436_LAS_2019.prj
PROJCS["NAD_1983_2011_Contiguous_USA_Albers",GEOGCS["GCS_NAD_1983_2011",DATUM["D_NAD_1983_2011",SPHEROID["GRS_1980",6378137.0,298.257222101,AUTHORITY["EPSG",7019]],AUTHORITY["EPSG",1116]],PRIMEM["Greenwich",0.0,AUTHORITY["EPSG",8901]],UNIT["Degree",0.0174532925199433,AUTHORITY["EPSG",9102]],AUTHORITY["EPSG",6318]],PROJECTION["Albers",AUTHORITY["Esri",43007]],PARAMETER["False_Easting",0.0,AUTHORITY["Esri",100001]],PARAMETER["False_Northing",0.0,AUTHORITY["Esri",100002]],PARAMETER["Central_Meridian",-96.0,AUTHORITY["Esri",100010]],PARAMETER["Standard_Parallel_1",29.5,AUTHORITY["Esri",100025]],PARAMETER["Standard_Parallel_2",45.5,AUTHORITY["Esri",100026]],PARAMETER["Latitude_Of_Origin",23.0,AUTHORITY["Esri",100021]],UNIT["Meter",1.0,AUTHORITY["EPSG",9001]],AUTHORITY["EPSG",6350]],VERTCS["NAVD88 (height) (ftUS)_1",VDATUM["North_American_Vertical_Datum_1988",AUTHORITY["EPSG",5103]],PARAMETER["Vertical_Shift",0.0,AUTHORITY["Esri",100006]],PARAMETER["Direction",1.0,AUTHORITY["Esri",100007]],UNIT["Meter",1.0,AUTHORITY["EPSG",9001]]]
Where the "Meter" is was originally "Feet", so I changed it. You can do this manually or in ArcGIS Pro by modifying the projection and saving it. I created a simple model with an iterator that would run through the las files and copy the projection file so it would match each las file.
It's looks to me yours might be in meters, but need to be set to feet, from the image you shared. Basically, the opposite of what I did with the Redlands lidar. You can create a projection file for one tile, change it from meters to feet and see if it works.
Here's one that might work, copy and paste below into a txt file. Then rename with las name and change from .txt file to .prj.
PROJCS["NAD_1983_2011_UTM_Zone_18N",GEOGCS["GCS_NAD_1983_2011",DATUM["D_NAD_1983_2011",SPHEROID["GRS_1980",6378137.0,298.257222101]],PRIMEM["Greenwich",0.0],UNIT["Degree",0.0174532925199433]],PROJECTION["Transverse_Mercator"],PARAMETER["False_Easting",500000.0],PARAMETER["False_Northing",0.0],PARAMETER["Central_Meridian",-75.0],PARAMETER["Scale_Factor",0.9996],PARAMETER["Latitude_Of_Origin",0.0],UNIT["Meter",1.0],AUTHORITY["EPSG",6347]],VERTCS["NAVD88_height_(ftUS)",VDATUM["North_American_Vertical_Datum_1988"],PARAMETER["Vertical_Shift",0.0],PARAMETER["Direction",1.0],UNIT["Foot_US",0.3048006096012192],AUTHORITY["EPSG",6360]]
I'll be on the question and answer team for the Imagery Showcase booth this year for Elevation and Lidar if you want to ask some questions in person.
Thanks,
Arthur Crawford
Living Atlas Team/Community Maps
Thanks Arthur!
I was able to resolve my vertical problem. I will seek out the Imagery Showcase booth (virtually) with other questions I have.
Speaking of which, I get to the Colorize Las stage of your workflow and no matter what adjustments I make to the tool settings, I still just end up with a grey colorized lasd. I'm thinking I must be missing something really basic but the solution hasn't been forthcoming! See attached.
It looks like you are using NAIP as an imagery source. Did you download the NAIP locally and is it matching the area of the point cloud?
Arthur Crawford - Esri
Thanks, Arthur. I did download the NAIP locally and it matched the area of the point cloud, so I'm not sure what the issue was.
However, I performed the same colorization using ESRI's NAIP service and it worked perfectly!
Thanks again.
Arthur CrawfordIs there a way to smooth multipatch?
Hi Rickey, good to hear from you. How's Ashland theses days? There is not a real good way to do that right now. It's something we have asked for, several universities and companies are working on. The goal would be to take a tin building and then flatten the roofs, superstructure and the sides of the buildings. I assume this is a building generated from a tin approach. There is some ideas of taking the planes generated to extend to the outside of the building polygon. Have you tried to segment roof tool with the Local Government 3D Basemap Solution?
Arthur Crawford
This was made from lidar points using LAS building Multipatch. I have tried different Simplification Tolerance but I have found one that works.
Hi Rickey,
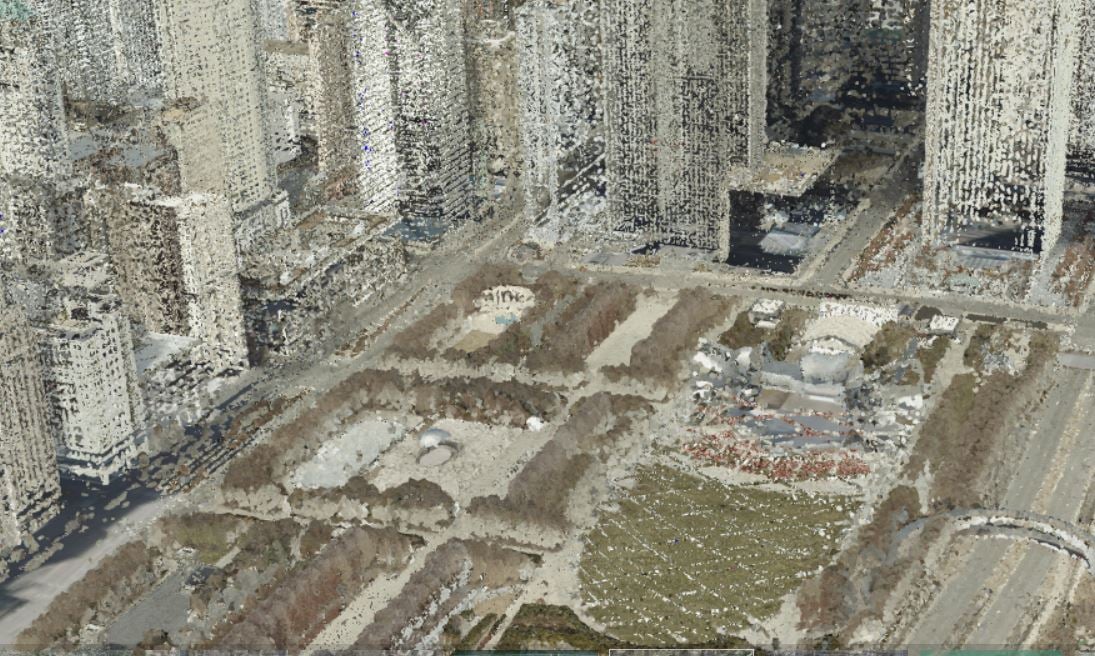
Is your intent to use the multipatches for analysis and use a colorized point cloud for rendering? I did something like that for Chicago using the LOD1/LOD2 buildings with a transparency. With the 3D trees in as multipatches as per the Local Government 3D Basemap, you could do some nice 3D analysis like line of sight or flood estimations with it. With both set to a 100% transparency, then use the point cloud for rendering quickly.
At this point whatever I can display nicely online is what I will go with.
Hi @ArthurCrawford,
Very cool looking scenes!
Can you colorize a point cloud scene layer with imagery?
Simon
@ArthurCrawford I wanted to share the St. Louis imagery web app linked in the blog (https://www.arcgis.com/home/webscene/viewer.html?webscene=6ece8b4050294139969fc4c10ad6b9b1) with my students in a Geovisualization and Cartography class. When we log in to our org we can see it, but we get a few layers that are "service not found" or "You do not have permission to access this resource". They are:
St Louis Iconic Waterfront Features 3D
City of St. Louis Lidar Dec 2016 Colorized
CityofStLouis_6_27_2018
Was trying to show them how the Colorize LAS tool worked and our computers were not happy (end of semester and not great graphics cards) but the colorized lidar was not showing up in this. 🙂 Thanks in advance.
Best, @shannonhwhite (not sure why its not defaulting to my wm-gis org account but either way I will get it).
サインインしたメンバーは投稿、更新のフォローなどができます。初めてですか?無料アカウントを登録してください。
Find useful guides, FAQs, and documents to help you navigate and make the most of Esri Community.