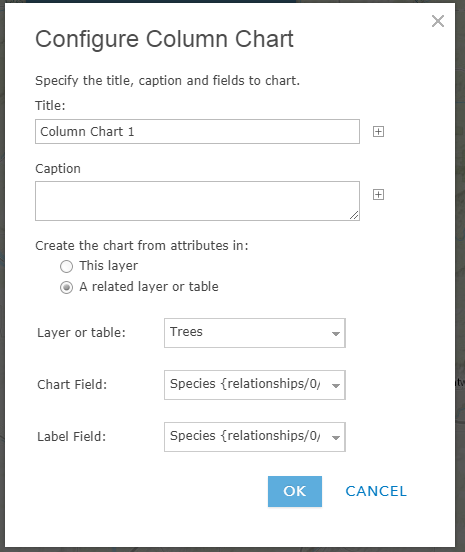
グラフを追加して
関連テーブルからグラフを選択し
グラフとラベルのフィールドを設定して
「OK」をクリックします
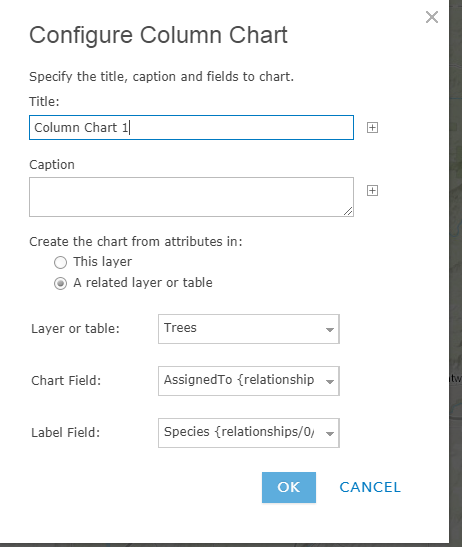
歯車アイコンをクリックして設定すると、グラフのフィールドが常にリストの最初のフィールドに戻ってしまいます。
これはバグか何かでしょうか? なぜ元に戻ってしまうのでしょうか?
設定
もう一度開く
ありがとうございます
Also the help says I can pick a table or a popup for related records but how? I see no option for this - it always shows me a table no matter what.
With a one-to-many relationship, choose to display the related data in the pop-up window or in a table.
Having this EXACT same issue - filing a case with Esri Support now.
Have you heard anything back on this?
Thanks,
Nope I just gave up on it. Never had much success with any Esri charts really.
Submitted a case to Esri, they already have it logged as BUG-000104430 which was originally logged on 4/10/2017. Let's hope for a fix in the December update!
Though not the exact same use case, if you can, give the Dashboard Theme with the Infographic widget a try - their best attempt at charts and graphics yet.
サインインしたメンバーは投稿、更新のフォローなどができます。初めてですか?無料アカウントを登録してください。
Find useful guides, FAQs, and documents to help you navigate and make the most of Esri Community.