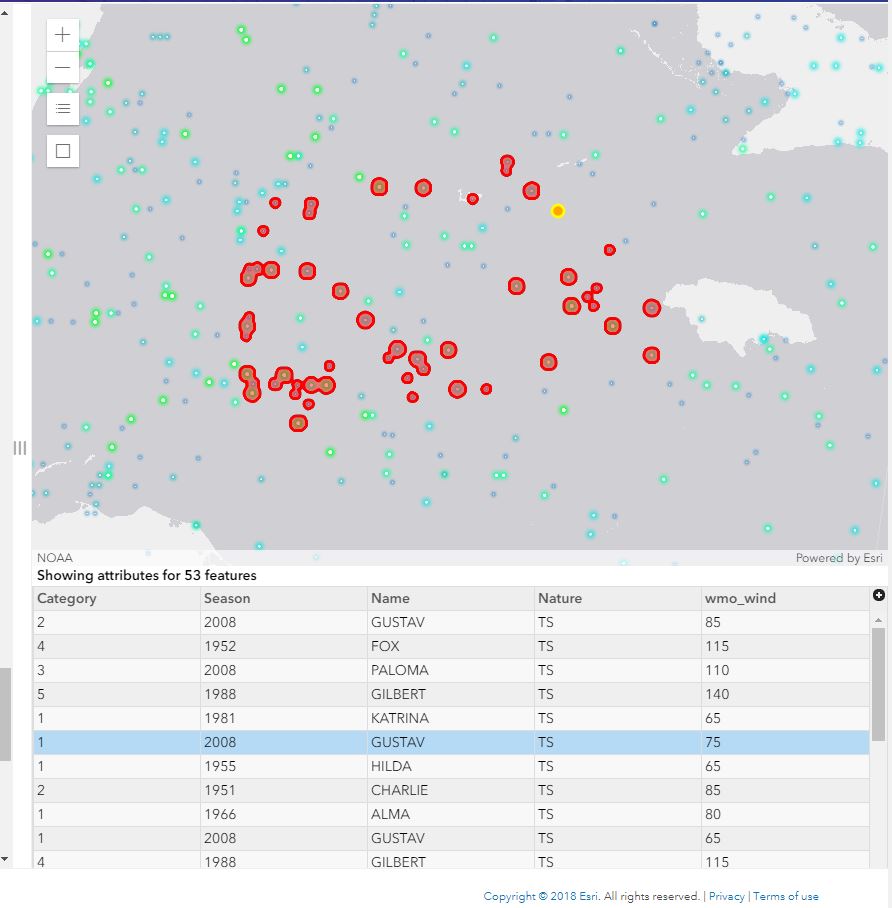
How to add a graphics to selected object...So after performing query task, when we click on any record in grid it highlights that specific record on map with specific color..
i tried this with using
popup: {
highlightEnabled: true,
dockEnabled: true,
dockOptions: {
position: "top-right",
breakpoint: true
}
}
refering sample
https://developers.arcgis.com/javascript/latest/sample-code/sandbox/index.html?sample=highlight-features-by-geometry
am expecting the graphics like below image..