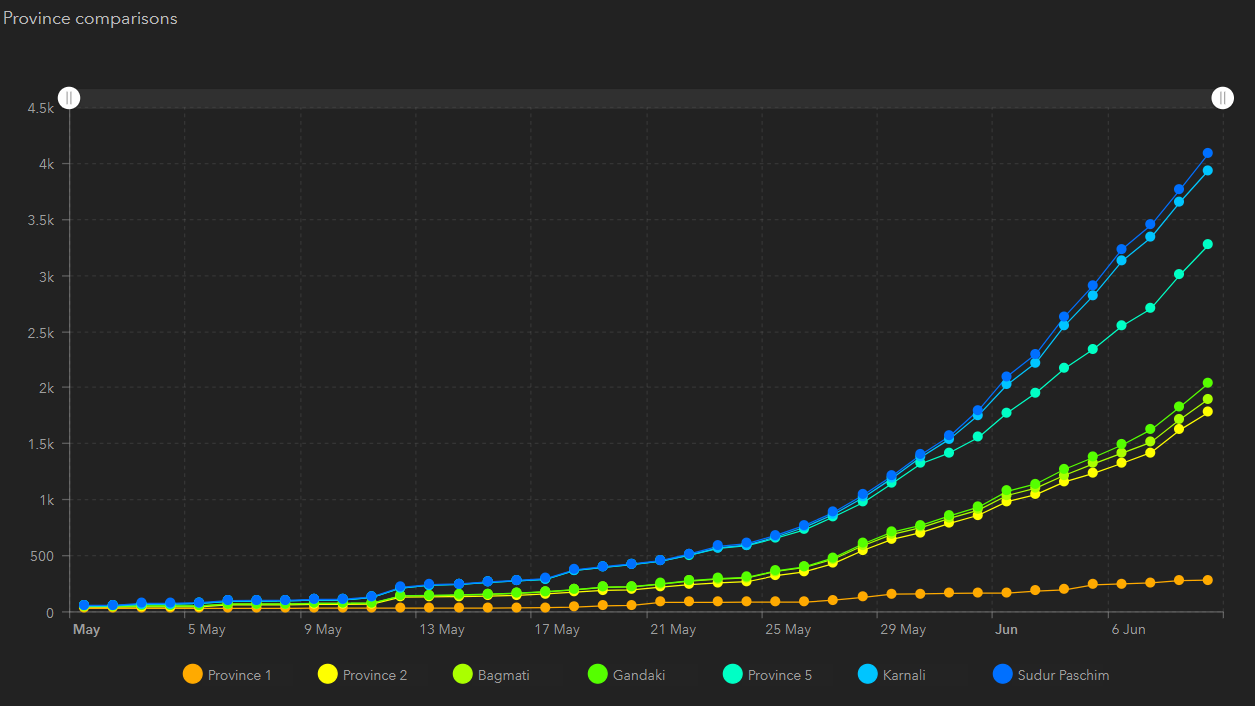
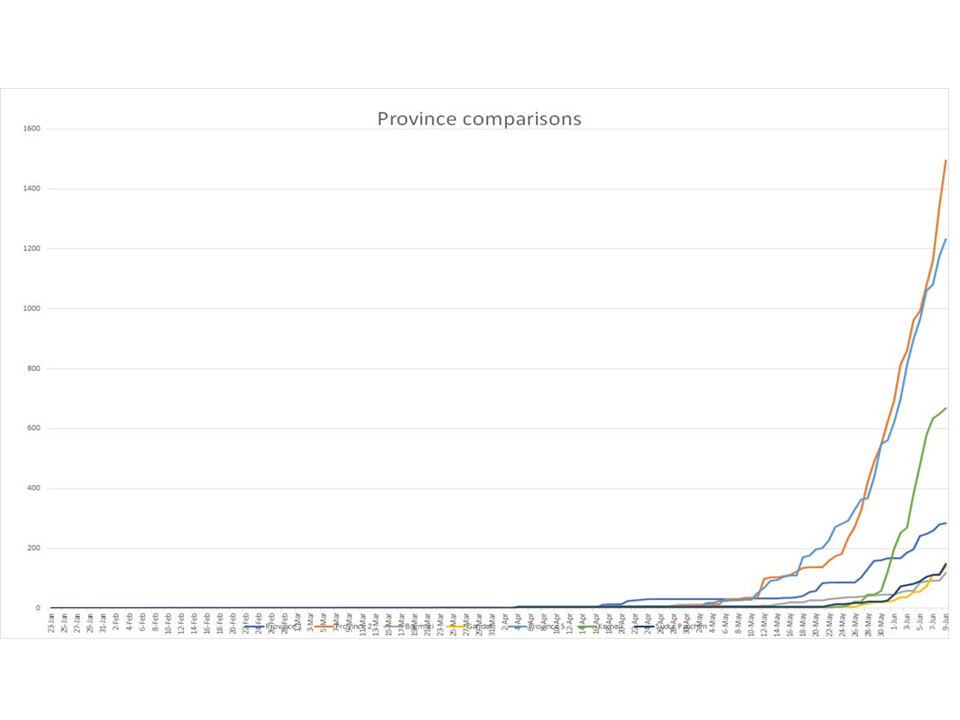
I would appreciate your help on this: What might have caused the graph look different for the same data in Operational Dashboard and Excel? The first graph is serial chart on Op Dashboard, and second graph is a line graph on MS excel. The MS Excel chart seems to be right. But why is the graph different in op dashboard? IS there something I am missing? I have attached the data table that created both graphs. Thank you.