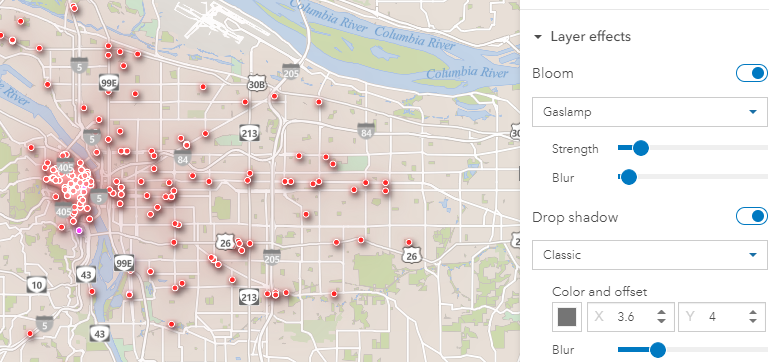
While I'm appreciating the new ability to enhance symbology with Layer Effects in 2022.3...
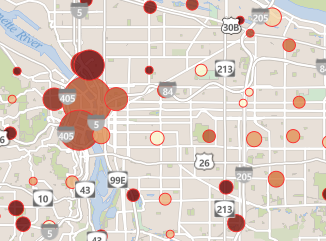
I'm looking for a way to symbolize data by Clusters like you can with a layer in a web map...
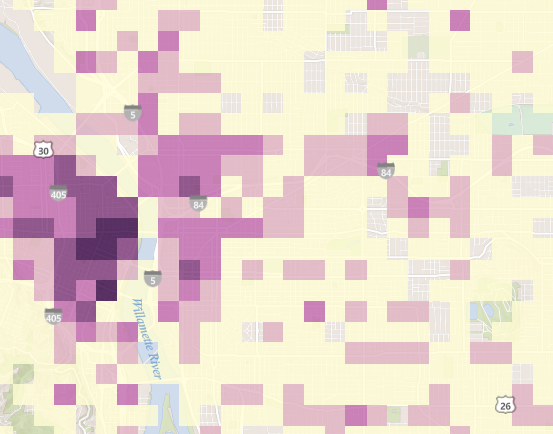
instead of by Bins in Insights...
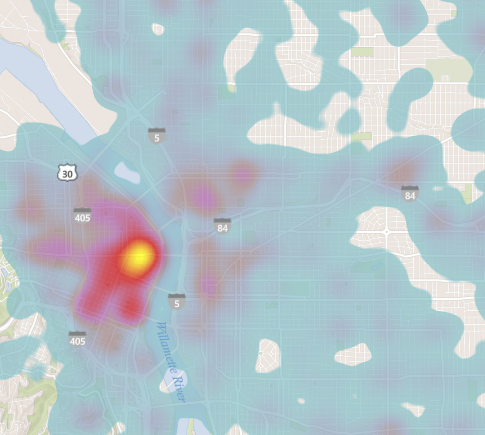
or Heat Map (Insights)...
Can this be done or is it just an idea at this point?
Paul
City of Portland, Oregon


