Hi I have noticed that ESRI has its own attribute called "ESRI Symbology" for categorizing the FEMA Flood zones in this Living atlas service: https://www.arcgis.com/home/item.html?id=2b245b7f816044d7a779a61a5844be23
I filtered the dataset for only 0.2% Annual Chance Flood Hazard, but I am still noticing Flood Zone Subtypes that are not a 0.2% Annual Chance still within the service after this filter is applied and I am wonder how ESRI + FEMA decided on this?
I did some digging an noticed that when the filter below is applied, Flood Zone Subtypes still shows areas of 1 Percent Depth Less Than 1 Foot, Area of Special Consideration and 1 Percent Drainage Area Less Than 1 Square Mile as an ESRI symbology of 0.2% Annual Chance Flood Hazard.
"esri_symbology = '0.2% Annual Chance Flood Hazard' And ZONE_SUBTY NOT IN ('0.2 PCT ANNUAL CHANCE FLOOD HAZARD IN COMBINED RIVERINE AND COASTAL ZONE', '0.2 Percent Annual Chance Flood Hazard', '0.2 Percent Annual Chance Flood Hazard Contained in Channel', '0.2 Percent Annual Chance Flood Hazard Contained in Structure', '0.2 Percent Annual Chance Flood Hazard in Coastal Zone')"
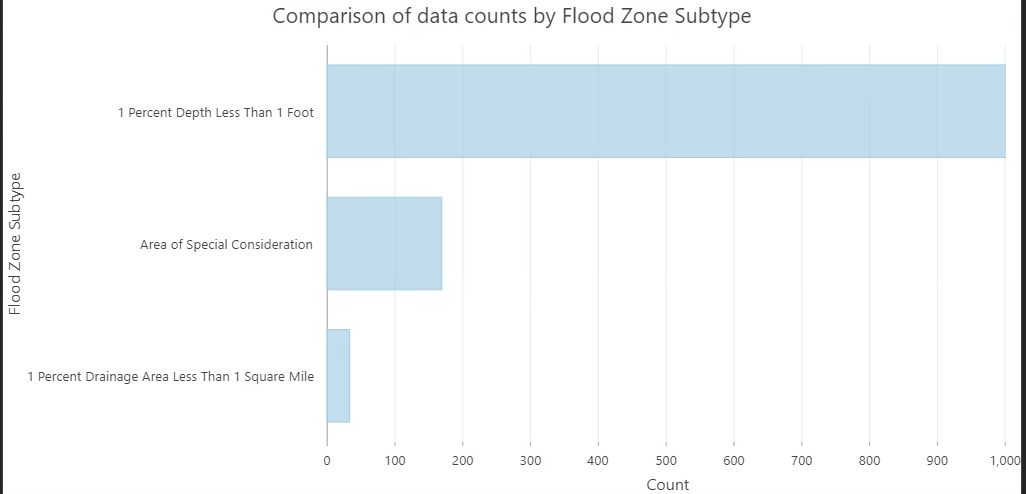
This seems incorrect to what documentation FEMA has on their site. https://www.fema.gov/glossary/flood-zones
Again I am just looking for some clarity as to how the "esri_symbology" category was curated.
Thanks!!




