I want to fill a symbol or on a map or a filled shape chart using esri data.
I have been requested to make it like a tea cup diagram.
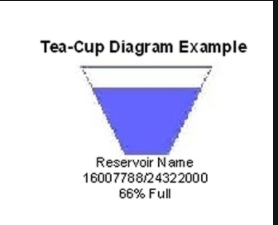
I know this is a static image but was wondering if there is a way to do this dynamically.
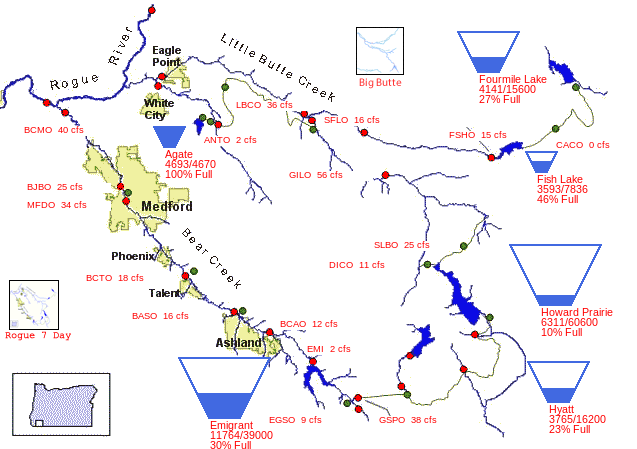
https://www.usbr.gov/pn/hydromet/roguetea.html


