I want to place lines along an existing line. For that im using the tool 'make route event layer'. In the event table are my lines. The problem is that the lines with a length of 1 meter are not showing in ArcGIS (no shape length) and the lines with a length of 2 meter are showing. What goes wrong here and what do i have to change?
Hi Maarten,
Found your 1 meter segment.
This is what i did.
Yes its working! Thank everyone for the help:) I hope i can help you guys too with ArcGIS questions.
Thanks!!.... I would have thought it would be linked to the Thread .... This will take some getting use to! If I could I would mark this Answered!
Go to Content -> Document (Next to all content and blogs), you'' find maarten's upload there.
I believe Riyas and Richard have answered your question !
On a side note you mentioned that you uploaded your Feature Class or Event Table. I am still trying (struggling) to learn this new forum. Riyas or Richard where did you find the uploaded file(s)? I did not notice and attachment or option which listed uploaded files. -- Out of curiosity and learning the new forum.
Maarten -- Hopefully your problem is resolved
Maarten Bos wrote: Have you tried it by yourself? Maybe its ArcGIS that doesnt allow lines shorter as 2 metres?
Maarten Bos wrote:
Have you tried it by yourself? Maybe its ArcGIS that doesnt allow lines shorter as 2 metres?
My routes use feet as the units and with my tolerance and resolution settings I can create segments of 1/1000th of a foot long. This exceeds our Survey data accuracy, and ensures I have no loss of accuracy when I use measurements from these documents.
If you are unable to reproduce the results Riyas showed that he achieved with your data, you should give a more complete description of the exact steps you are following (the exact tools, menus, dialog inputs, etc) to get the best help.
I still think that even .0001 kilometers tolerance is too rough. That is only 1/10th of a meter (0.1 meters) as your shortest line segment. Survey documents in the U.S give distances as small as 1/100th of a foot (≈ 0.00304800610 meters)
This is strange, Provided you are getting 'zero length extent' error, I would have expected Richard's suggestions would have fixed your issue.
Can you update your line feature with attributes stripped out, that will help in identifying or reproducing the issue rather than speculating.
When i see the GDF (line)-layer, the M-values are in km. I changed the M resolution and the M tolerance to 0.0000001 and still the 1 meter lines are not showing. I have tried already to change my values to metres but that wasnt working too. But its so strange that the 2 meter lines are showing because its only 1 meter difference.
If your XY is in kilometers, what is the XY resolution and tolerance? It should be submeter levels also. Additionally, your routes are built in km, so your resolution is not .0001 meters, it is .0001 kilometers and the tolerance of .001 will control the length. M Resolution and tolerance are unitless and determined only after a route measure system is defined from whatever units you used. This setting means that if 2 measures are within .001 units of each other (no matter what type of units they represent) they are considered the same position and will be adjusted to eliminate one of the positions. If you really want km measures you need an M resolution of about .0000001 and a tolerance of .000001 for the measures to work to allow 1 meter lines (.001 measures) with reasonable submeter accuracy levels, unless you want really coarse measurements. .001 km is really coarse accuracy.
Alternatively remeasure all of your routes by converting the measure positions at every vertex multiplied by 1000 to convert the measures to meters. Then your M Resolution and Tolerance will behave as .0001 meter resolution and .001 meter tolerance. Of course then your event measures will also have to be multiplied by 1000 to match. It sounds like you just changed the event measures, which does no good if the routes are not remeasured to match.
Thank you all for your help! I use the 2 overlapping lines only to show that the 1 meter line is not showing and the 2 meter line is showing. In the attribute table i see that the shape lenght is '0' for the 1 meter line so it doesnt exist. I had also generating an error field and for the 1 meter lines it says 'zero length extent'. Also i tried to change the distance in meters but then nothing is showing.
As Ted mentioned, for both of your examples, the sets of line segments have overlapping measures that will cause the 1 meter line to fall inside of a 2 meter line. Since all your lines are the same color and thickness and no end markers, there is no way you will ever see the overlapping lines as separate features, but they are actually there, whether you see them or not. It appears you have select both segments so that again only the longer one is visibly highlighted. To demonstrate that you actually have a real problem you need to filter out the 2 meter long segments by using a definition query like:
to_KP_km - from_KP_km < .0015
If the 1 meter lines still don't show then the problem is real. But if they do show up after applying the filter then this is simply due to the fact that you are obscuring the 1 meter lines by overlapping the segments.
To use symbology to show that there are actually 2 lines of different lengths that share a segment without using a filter, you would have to add end cap markers to the lines, and use a categorized or proportional symbol that varied the line colors and thicknesses according to the line lengths. I would change the values in the Length_M field to be correct (since they are not correctly reflecting the measure lengths for the 2 meter long lines) and use that to vary the symbols. Additionally, to ensure the lines draw in an order where thinner lines draw on top of thicker lines you would have to do a decreasing length sort of the event table so that the shorter events draw last on top of the longer events, or use separate layers with different definition queries to make shorter lines draw last in the top most layer.
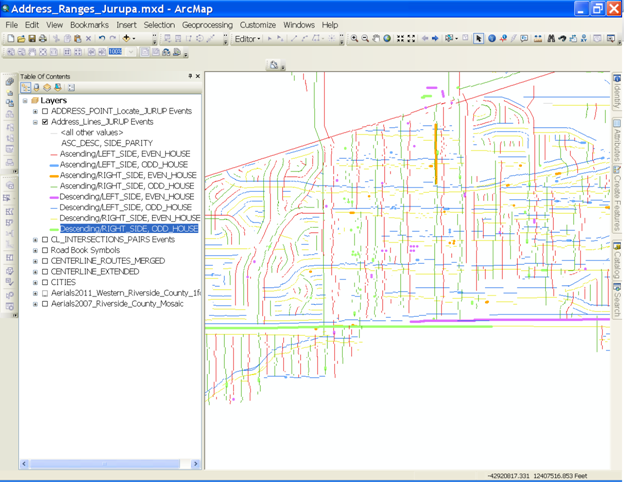
I am not clear what this data is showing or why you would want to create overlapping segments. Most event tables do not contain overlapping events for one attribute type, like speed zones or lanes, unless there is a right and left hand offset to separate the overapping line types. If a left and right hand offset applies then there is a setting to use a numeric field with positive/negative values that will offset the lines left and right so that they do not overlap. Below is an example where I use different symbol categories from two fields to separate overlapping line types using color. Another field is used in the event layer set up to control the left and right hand offsets. These lines represent house number address range data patterns for each side of the road. The side offsets were determined by the position of the actual address point relative to the central lines (the Centerlines are not being shown in this example, only the offset lines). The thicker lines are highlighting unexpected addressing patterns between house pairs with the same types of Orientation and Parity and the events were actually sorted according to their category and measure values to display them in a specific order. The order of the Symbol Categories in the layer symbology list also affects the order in which the lines are drawn, so technically I should move the thicker lines below the thinner lines in the symbol list to get the thin lines to always draw on top of the thicker lines wherever an actual overlap occurs between two different categories.
Riyas trouble shooting tips are very excellent way to start. Generating a field for errors is invaluable when troubleshooting LRS events.
To add on to some of Riyas comments... the LRS measure (chainage) is unitless. Typically it is done multiplied by a factor when your referencing system was created to convert the projection units to a measure of the users choice. For example when I create a Linear Referencing System here in Florida, USA I use a projection of State Plane in US Feet. So my M values are in Feet. I then multiplied all the values by factor to convert the M's to Miles. So now when I event map I can use Miles From and To.... So Riyas suggestion to convert your KM to Meters (Assuming the Reference System Measure Unit is in Meters) is probably an excellent start.
The other note I noticed is that route G32 (guessing this is what you used for your route name) will have overlapping segments
One segment from G32 From 12.000 to 12.001
Another overlapping above G32 From 12.000 to 12.002
This will create a line segment of two lines on top of each other with the bottom one slightly longer
_____
_________
Hopefully this helps somewhat.
I've moved your post into the Managing Data space.You will get a much better answer here as the GeoNet Help is intended for community help and feedback. I have also added in a few additional tags. You can see moreon the community structure, and what topics are under each space from the following documents:
GeoNet Community Structure
ArcGIS Discussion Forums Migration Strategy
Thanks!
Don
The first table has the lines (from_KP_km - to_KP_km) and it connects with the featureclass GDF (2nd picture) with FUGRO_CODE. With the tool make route event layer i want to put the lines from the table on the line in the feature class. The problelm is that only the lines with a length of 2 meter are showing (and not the lines of 1 meter).
Can you post some screenshots for my better understanding on what your issue is.
Hey Riyas,
Thank you for your help. The M-Resolution for the feature class is 0.0001 meter so i dont think thats the problem. Also you cant change the resolution of it. You can give the resolution if you make a new feature class but your are not able to change it in an existing feature class. Do you have another solution for this problem:)
xyz Maarten
Check your route feature class M Resolution possibly, it's >= 1.
Also please make sure you are posting your questions to correct forum, Geonet Help forum is for the general form related topic, Best place for your question would be Managing Data. This will help you in getting better help.
Les membres connectés peuvent publier, suivre les mises à jour, et plus encore. Nouveau ici ? Inscrivez-vous gratuitement.
Find useful guides, FAQs, and documents to help you navigate and make the most of Esri Community.