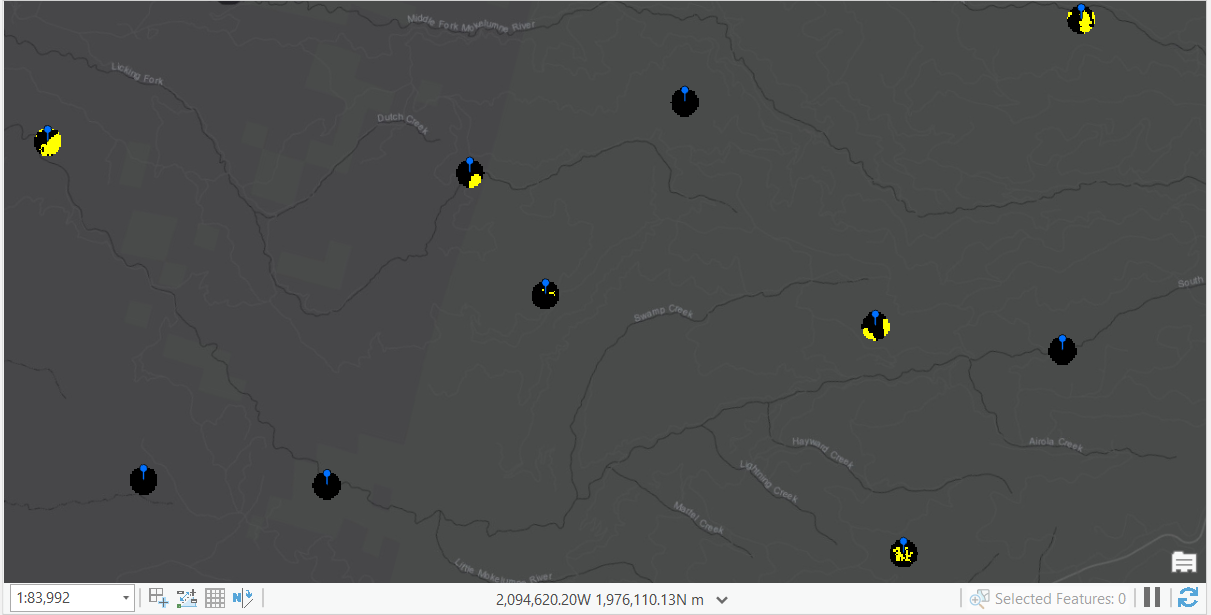
How could I find the percentage of change for each buffer area in the image below using ArcGIS Pro 2.5.0? I want to be able to show the percentage of change for each "unique" buffer/circle, so that I can create a histogram or some type of similar graph. The blue pins are point locations, the general circles are 250 meter buffers from the point locations, the yellow cells are equal to change, and the dark black cells are equal to no change.