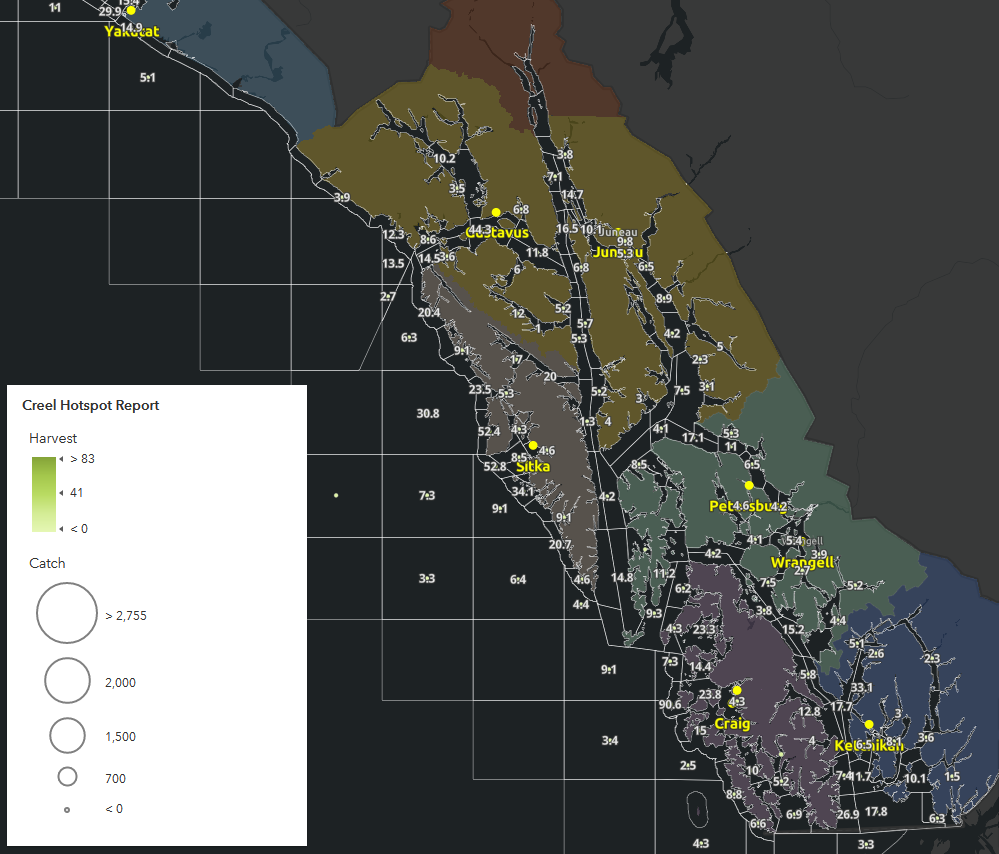
I am trying to use cluster mapping in the new Map Viewer to aggregate points and vary size using the sum of fish caught and shade using the sum of fish harvested. Based on the legend configuration, it seems that this ought to be possible that I have it basically set up, but the actual map doesn't reflect the legend.
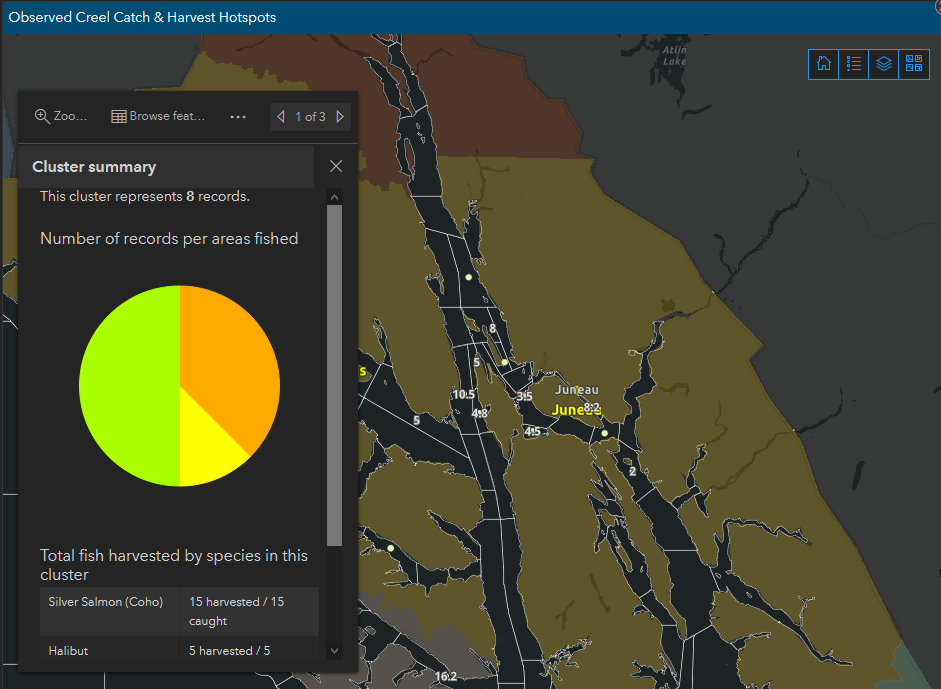
Furthermore, the aggregate point number labels do not reflect anything in the data that I can discern. For example, I clicked a cluster that is labeled with 3.5. There are 8 aggregated records in this cluster, and though the pop-up table is half-obscured in the picture below, there are a total of 28 fish caught and 20 fish harvested across three different fishing areas (referenced by the pie chart). Not sure where 3.5 is coming from.
Is this a bug? Has anyone else run into something similar, where the legend reflects the cluster configuration you're looking for yet the map is outputting nonsense? It is, as they say, a bit of a cluster.
Thanks!



