I made a Python toolbox with a simple tool for testing arcpy's charting functionality in Pro. I'm trying to plot a line chart from these data, which I imported into a geodatabase as a table:
x,y
1,4
2,2
3,4
I have a map named "Map" with the above table as the first table in the map. Here's the tool class's execute method:
<SPAN class="keyword token">def</SPAN> <SPAN class="token function">execute</SPAN><SPAN class="punctuation token">(</SPAN>self<SPAN class="punctuation token">,</SPAN> parameters<SPAN class="punctuation token">,</SPAN> messages<SPAN class="punctuation token">)</SPAN><SPAN class="punctuation token">:</SPAN>
aprx <SPAN class="operator token">=</SPAN> arcpy<SPAN class="punctuation token">.</SPAN>mp<SPAN class="punctuation token">.</SPAN>ArcGISProject<SPAN class="punctuation token">(</SPAN><SPAN class="string token">"current"</SPAN><SPAN class="punctuation token">)</SPAN>
map <SPAN class="operator token">=</SPAN> aprx<SPAN class="punctuation token">.</SPAN>listMaps<SPAN class="punctuation token">(</SPAN><SPAN class="string token">"Map"</SPAN><SPAN class="punctuation token">)</SPAN><SPAN class="punctuation token">[</SPAN><SPAN class="number token">0</SPAN><SPAN class="punctuation token">]</SPAN>
table <SPAN class="operator token">=</SPAN> map<SPAN class="punctuation token">.</SPAN>listTables<SPAN class="punctuation token">(</SPAN><SPAN class="punctuation token">)</SPAN><SPAN class="punctuation token">[</SPAN><SPAN class="number token">0</SPAN><SPAN class="punctuation token">]</SPAN>
c <SPAN class="operator token">=</SPAN> arcpy<SPAN class="punctuation token">.</SPAN>Chart<SPAN class="punctuation token">(</SPAN><SPAN class="string token">'MyChart'</SPAN><SPAN class="punctuation token">)</SPAN>
c<SPAN class="punctuation token">.</SPAN>type <SPAN class="operator token">=</SPAN> <SPAN class="string token">'line'</SPAN>
c<SPAN class="punctuation token">.</SPAN>xAxis<SPAN class="punctuation token">.</SPAN>field <SPAN class="operator token">=</SPAN> <SPAN class="string token">'x'</SPAN>
c<SPAN class="punctuation token">.</SPAN>yAxis<SPAN class="punctuation token">.</SPAN>field <SPAN class="operator token">=</SPAN> <SPAN class="string token">'y'</SPAN>
c<SPAN class="punctuation token">.</SPAN>addToLayer<SPAN class="punctuation token">(</SPAN>table<SPAN class="punctuation token">)</SPAN>
<SPAN class="keyword token">return</SPAN><SPAN class="line-numbers-rows"><SPAN></SPAN><SPAN></SPAN><SPAN></SPAN><SPAN></SPAN><SPAN></SPAN><SPAN></SPAN><SPAN></SPAN><SPAN></SPAN><SPAN></SPAN><SPAN></SPAN><SPAN></SPAN><SPAN></SPAN></SPAN>When I run the tool, a chart is added as shown below the table in the Table of Contents, but when I open the chart, instead of a chart I see "Select Variable(s) in the Chart Properties pane to begin". But the chart properties pane does show the variables selected.
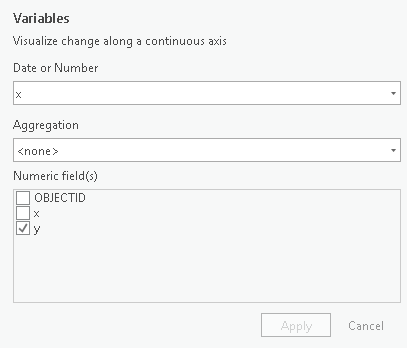
If I uncheck and then re-check "y" in the numeric fields list and click Apply, nothing happens. If I right-click the table to manually create a new chart, the chart previously created by my GP tool disappears.
