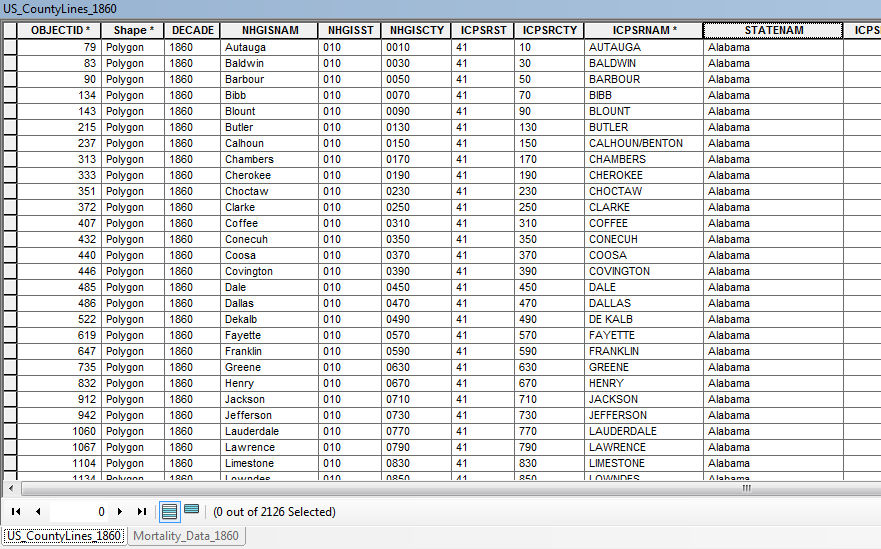
Is there a way to display graduated quantity data from a 1:M relationship? I have an 1860 U.S. county map from NHGIS (attribute table below) and a table of mortality data from the same decade (second attribute table below). The mortality dataset describes different age groups who perished from different diseases in every 1860 U.S. county.
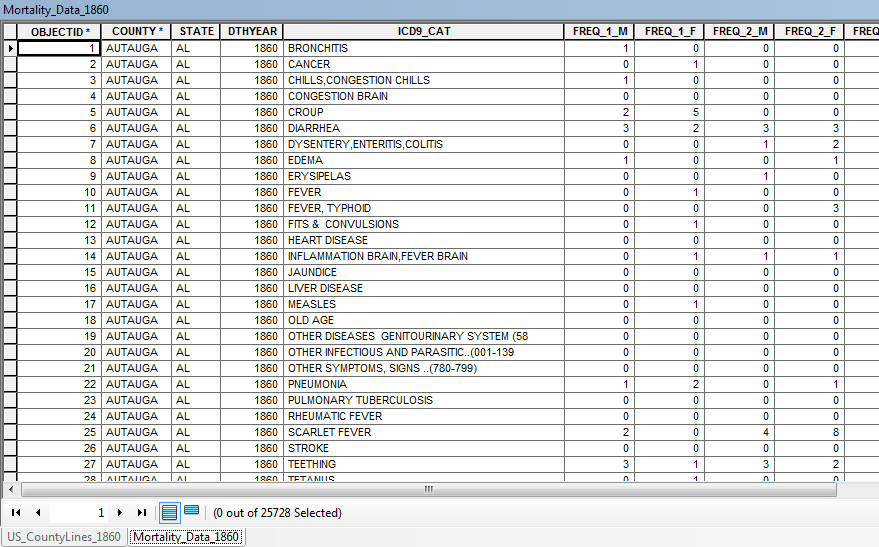
I would like to display each disease and age group by graduated colors for the entire U.S. county map. Is there a way to do this through a table relationship or does anyone have any tips for how I could reorganize these datasets to achieve my desired display? Thank you!