Hi,
I was wondering if it's possible to on a feature class within an ArcGIS Online Application, to create some sort of slider that would change how a feature class (such as a polyline) value's symbolized.
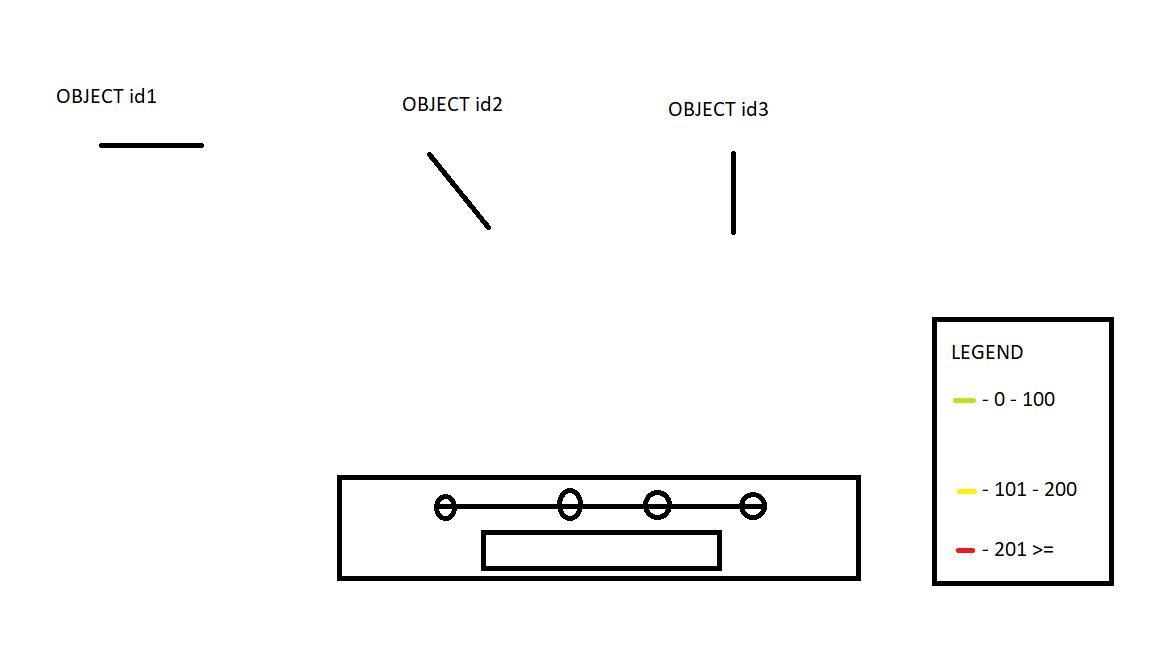
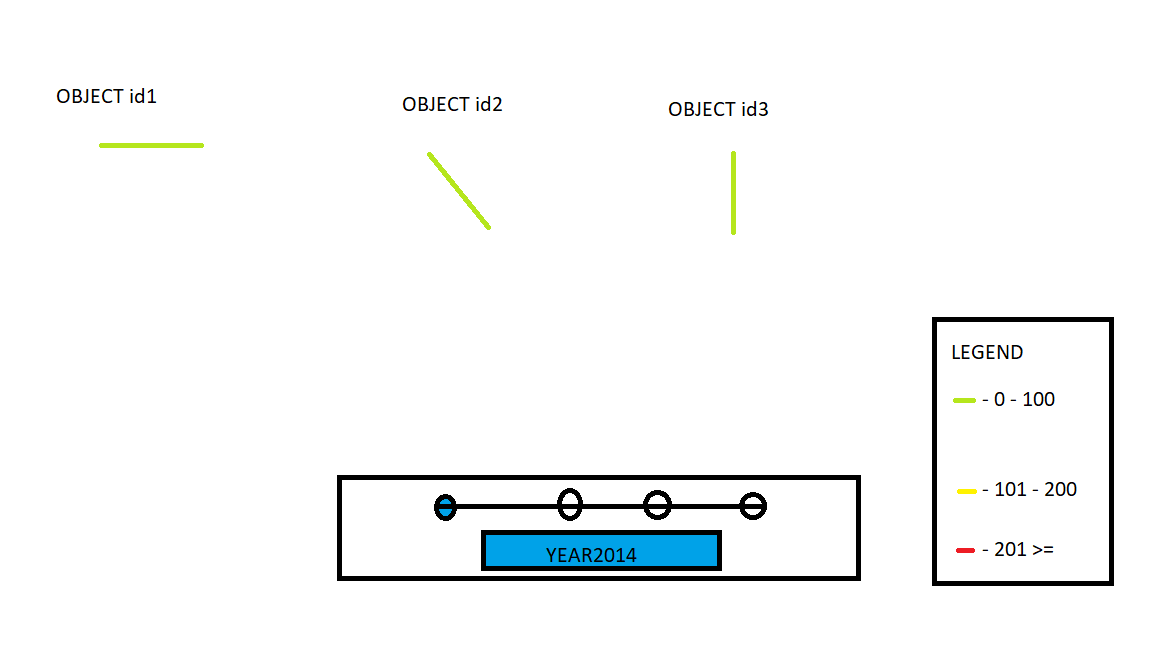
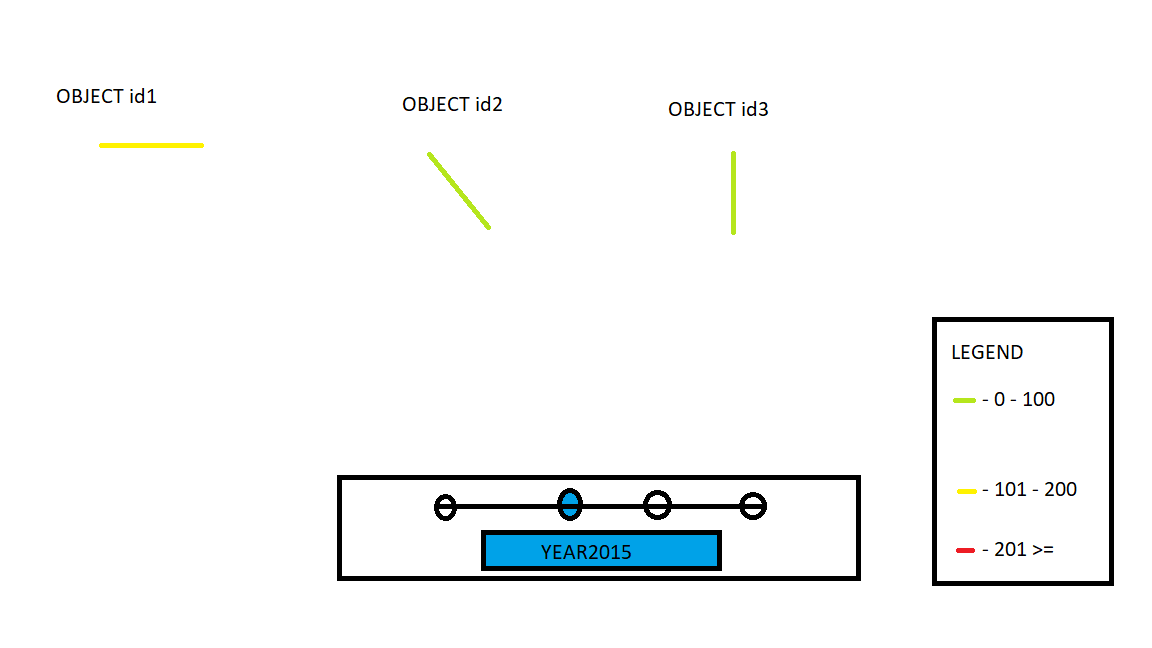
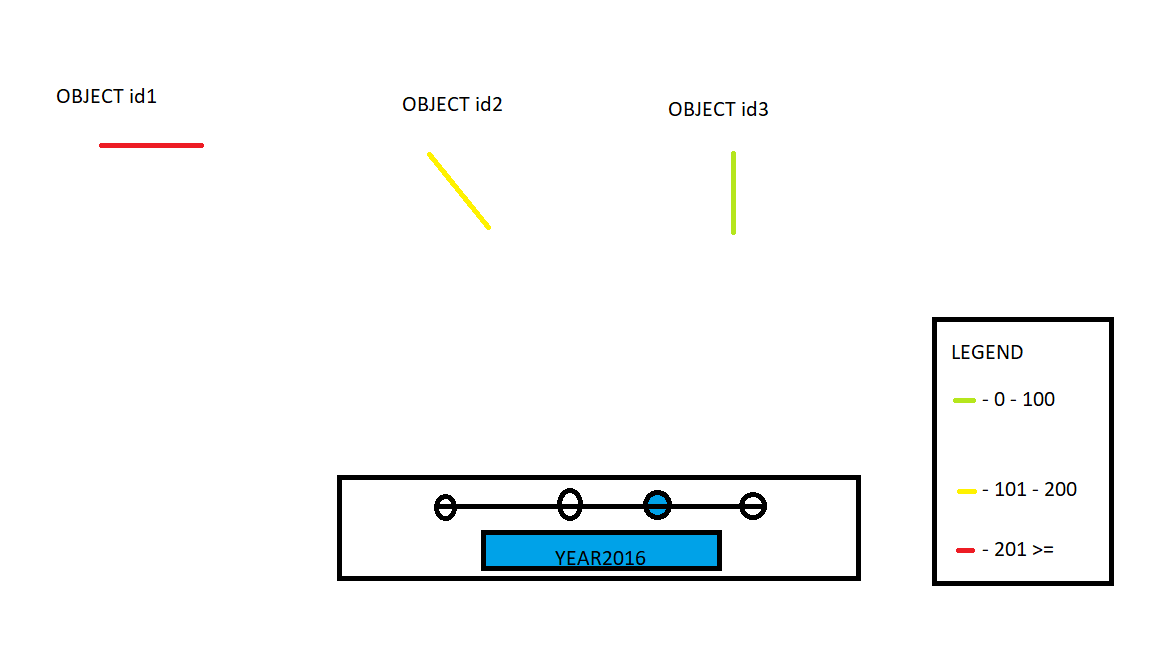
Here's a visual:
I have 3 lines
| OBJECTID | Year2014 | Year2015 | Year2016 |
|---|
| 1 | 100 | 200 | 300 |
| 2 | 50 | 100 | 150 |
| 3 | 67 | 87 | 92 |
I want to show the change over time in the feature class.. (OBJECTID1 is a good example)