I downloaded the World Temperature Change 2050 Scenario 2.6 from the Living Atlas to create a web map. The map's layer looks like this:
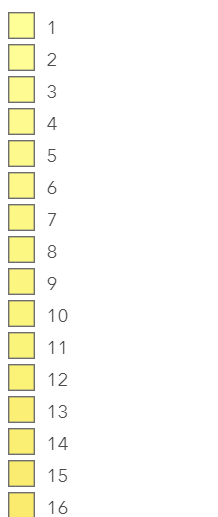
instead of showing degrees Celsius. When I used the classify the image display option, the whole image just goes all black and even if I try to make it go back to how it was before, it doesn't do anything.
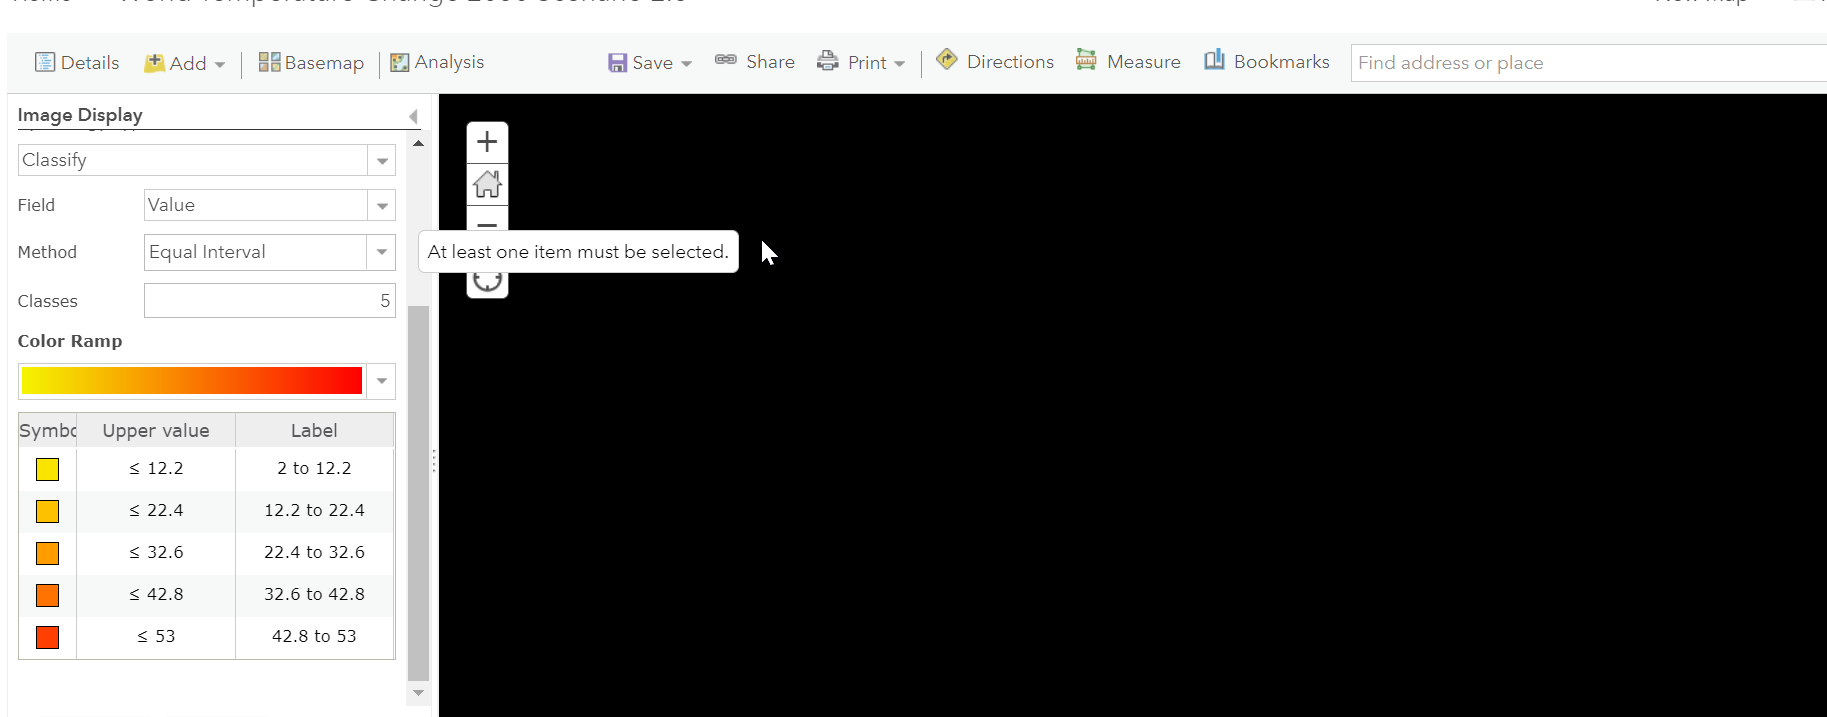
Any help will be greatly appreciated!
Isabel

