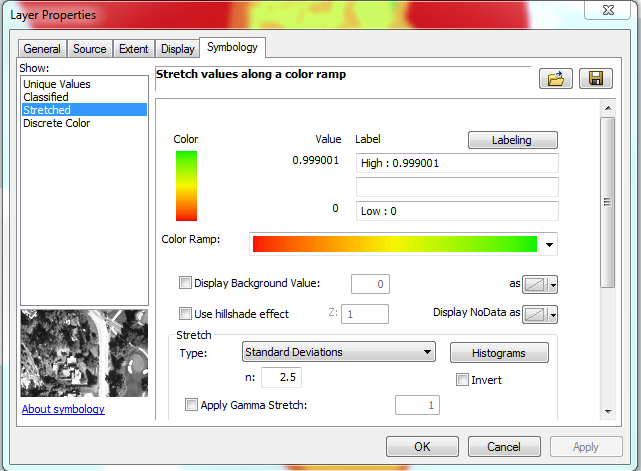
In my ArcMap project I have a grid. When displaying the grid with stretched values I see a range of 0 to (almost)1 like I would expect. See the first image below. I can use the identify tool to select pixels in the grid and the identify returns values from 0 to (almost) 1 as expected.
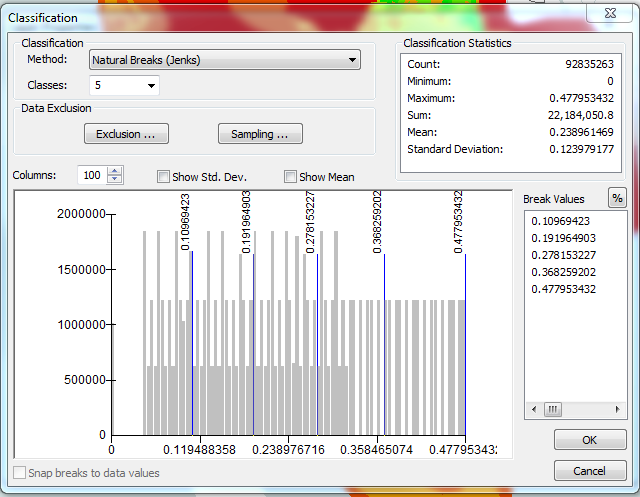
If I try to classify these data I am only allowed to classify values from 0 to 0.47 (see the second image below).
Why is there a difference between the stretched range and the classified range?
ArcGIS 10.1.2