Hi! I'm trying to build a data expression in an ArcGIS Online dashboard that will take a field called, HOUR_OF_CRASH, which is an integer field and not a time field, and populate a new field called, TOD, which will be a text field for the time of day the hour falls within so that the new field can be used to build a pie chart within the dashboard. The current data expression is shown below.
var portal = Portal("https://www.arcgis.com");

var fs = FeatureSetByPortalItem('d651aa4112e5408ea9a1cfabecd6485c', 23)
// Create schema for the returned FeatureSet
var fields = [
    { name: "HOUR_OF_CRASH", type: "esriFieldTypeInteger" },
    { name: "TOD", type: "esriFieldTypeString" }
];

var features = [];

for (var f in fs) {
    var hour = f.HOUR_OF_CRASH;
    var tod;

    if (hour >= 0 && hour <= 5){
        tod = "Night";
    } else if (hour >= 6 && hour <= 8){
        tod = "Morning";
    } else if (hour >= 9 && hour <= 15){
        tod = "Day";
    } else if (hour >= 16 && hour <= 23){
        tod = "Evening";
    } else {
        tod = null;
    }

    Push(features, {
        attributes: {
            HOUR_OF_CRASH: hour,
            TOD: tod
        }
    });
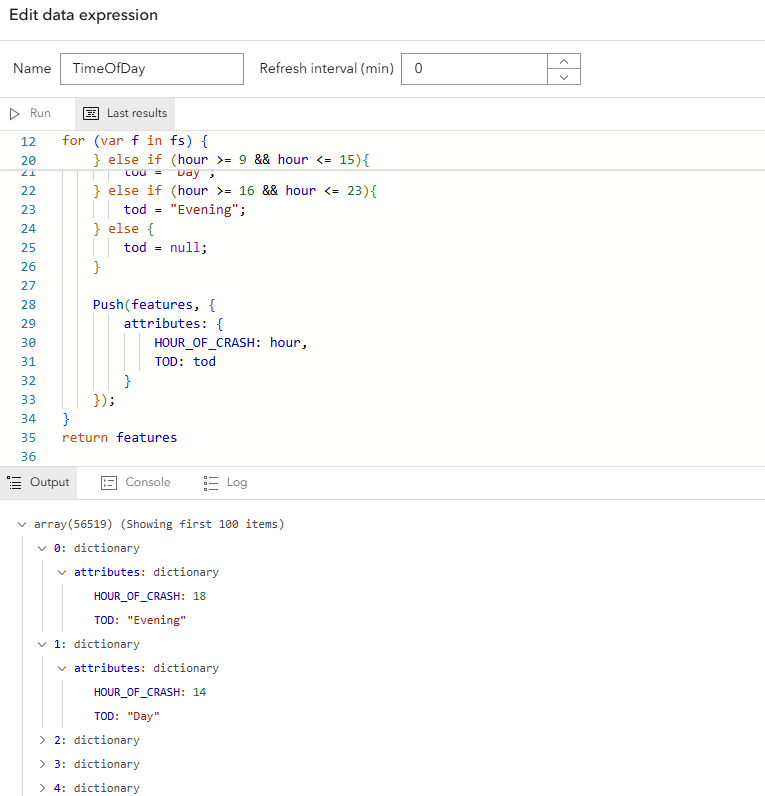
}Unfortunately, this data expression won't function within the dashboard and doesn't give me quite the output I am looking for in the end. See the below image of the output.
My experience with data expression is relatively limited. Any advice would be greatly appreciated!
Bec



