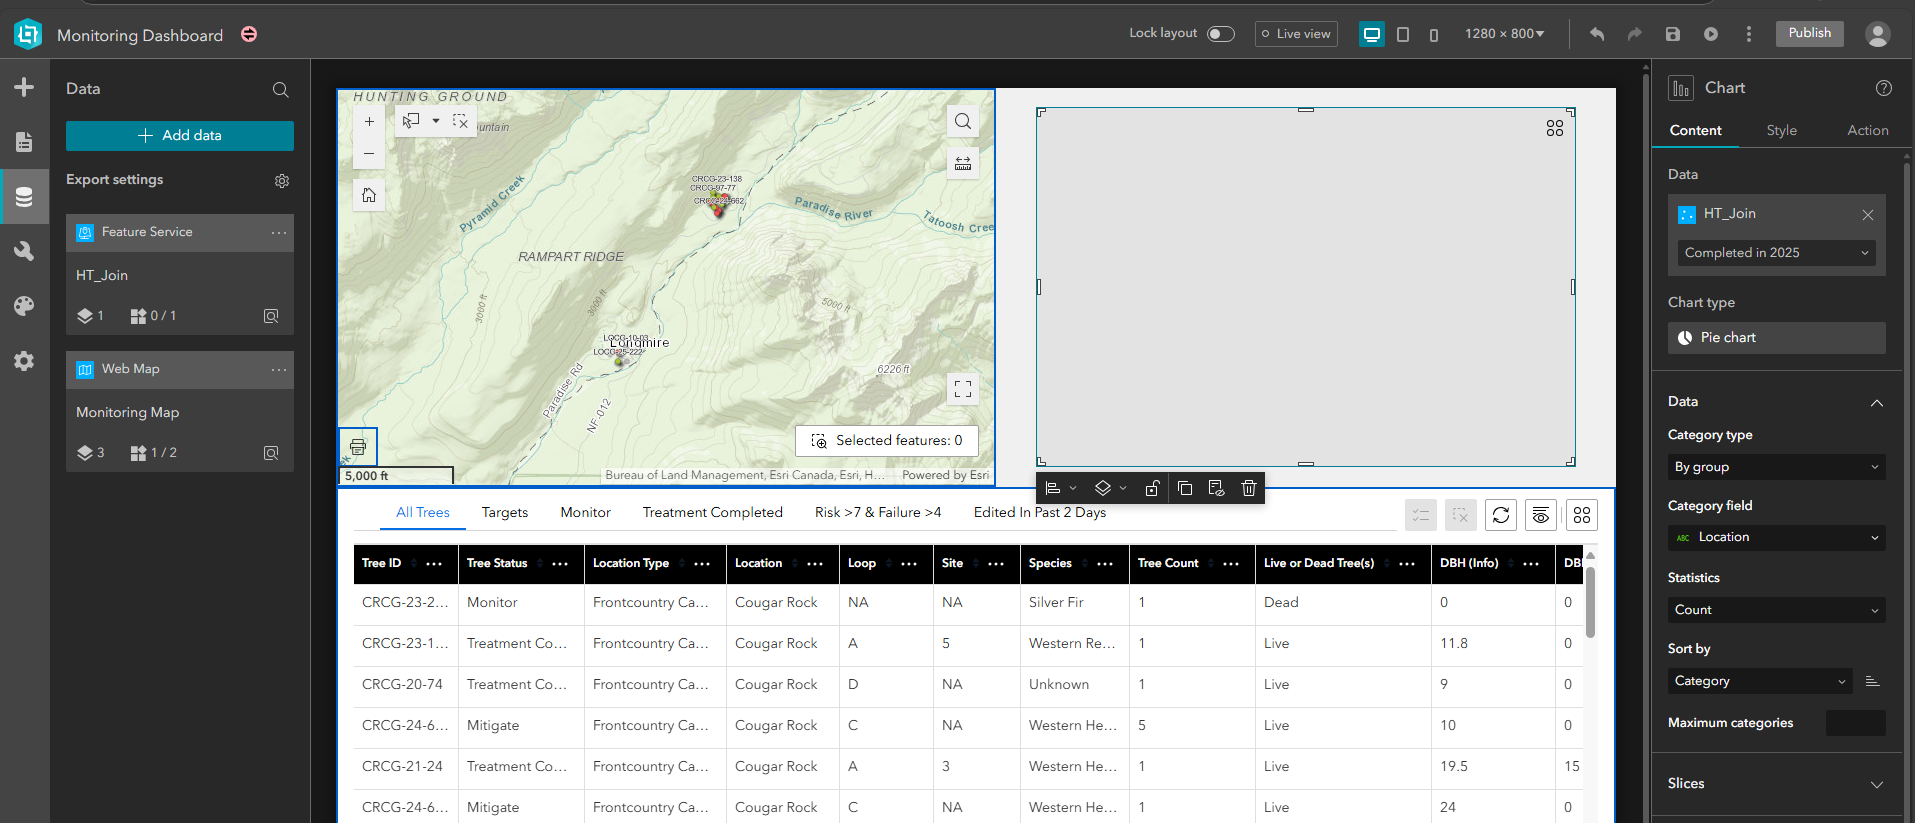
I am trying to create a simple pie chart in Exp Builder. I have selected the feature layer data and created a custom view based on activity date but when I select a Group Category type and the Count statistic for "Location," the chart blanks out completely.
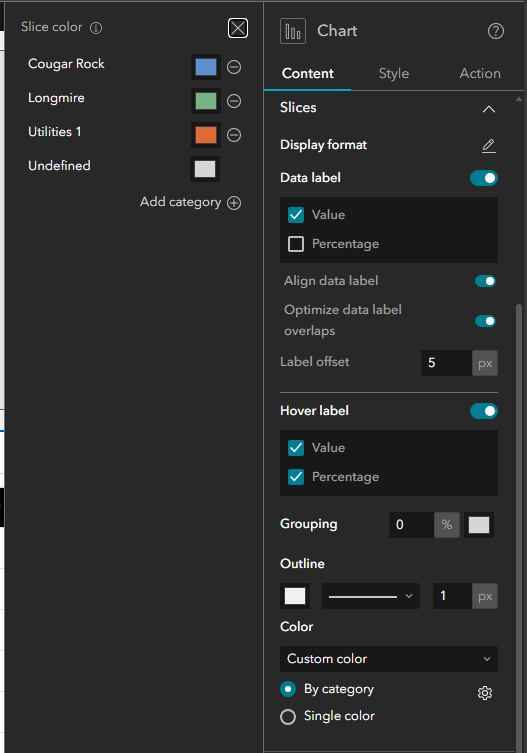
I can see the "Location" categories I expect in the Custom Color by Category so I know the data is connected.
Why is my chart blank?


