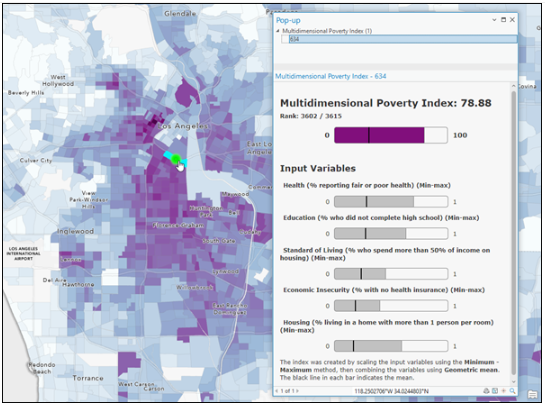
My question is in regard to the graphic that gets created inside a feature pop-up when the Calculate Composite Index tool is ran (see below):
Graphic is from Esri documentation her: How Calculate Composite Index works—ArcGIS Pro | Documentation
My organization is working in Pro 3.1.4 and this graphic doesn't show up until v3 (I think). Does anyone have insight around the code used to make the graphic? Is there a way it can be used in AGO or Pro?
Les membres connectés peuvent publier, suivre les mises à jour, et plus encore. Nouveau ici ? Inscrivez-vous gratuitement.
Find useful guides, FAQs, and documents to help you navigate and make the most of Esri Community.