Is there a way i can set this graph to show diffrent colors based on the values, i.e if the rating is 2 then the color changes to red and if the rating is 3 then the color changes to yellow?
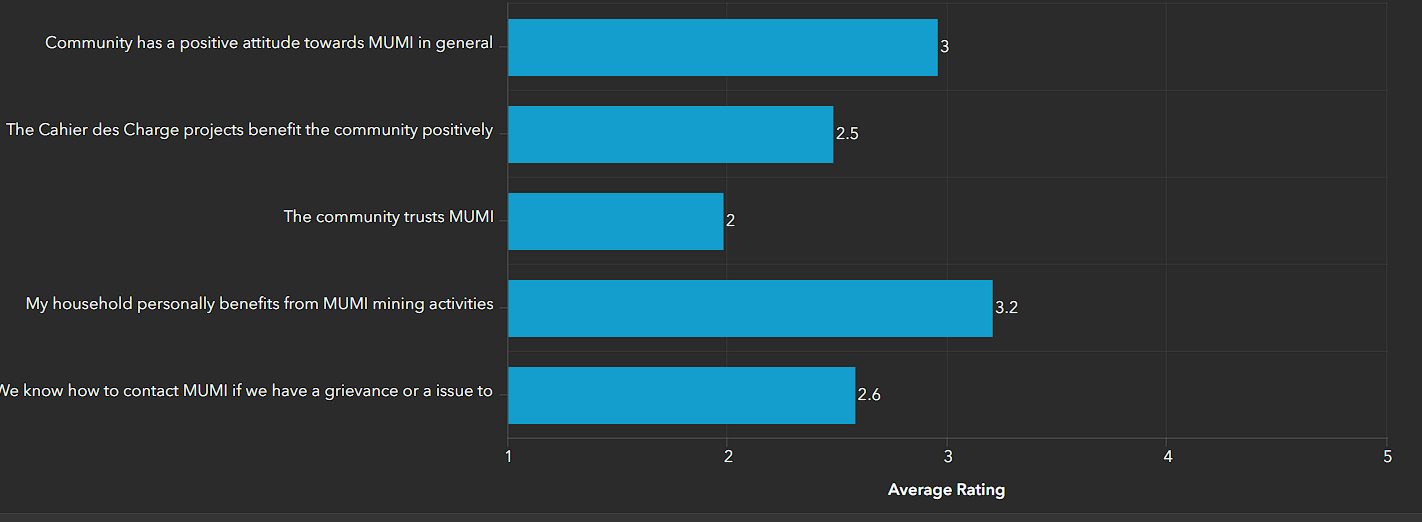
kindly note that this graph has a filter based on village number


