I built out a couple Multidimensional Multivariate Rasters and then use the Multidimensional toolbar to make Temporal Profiles super fast and it is pretty slick.
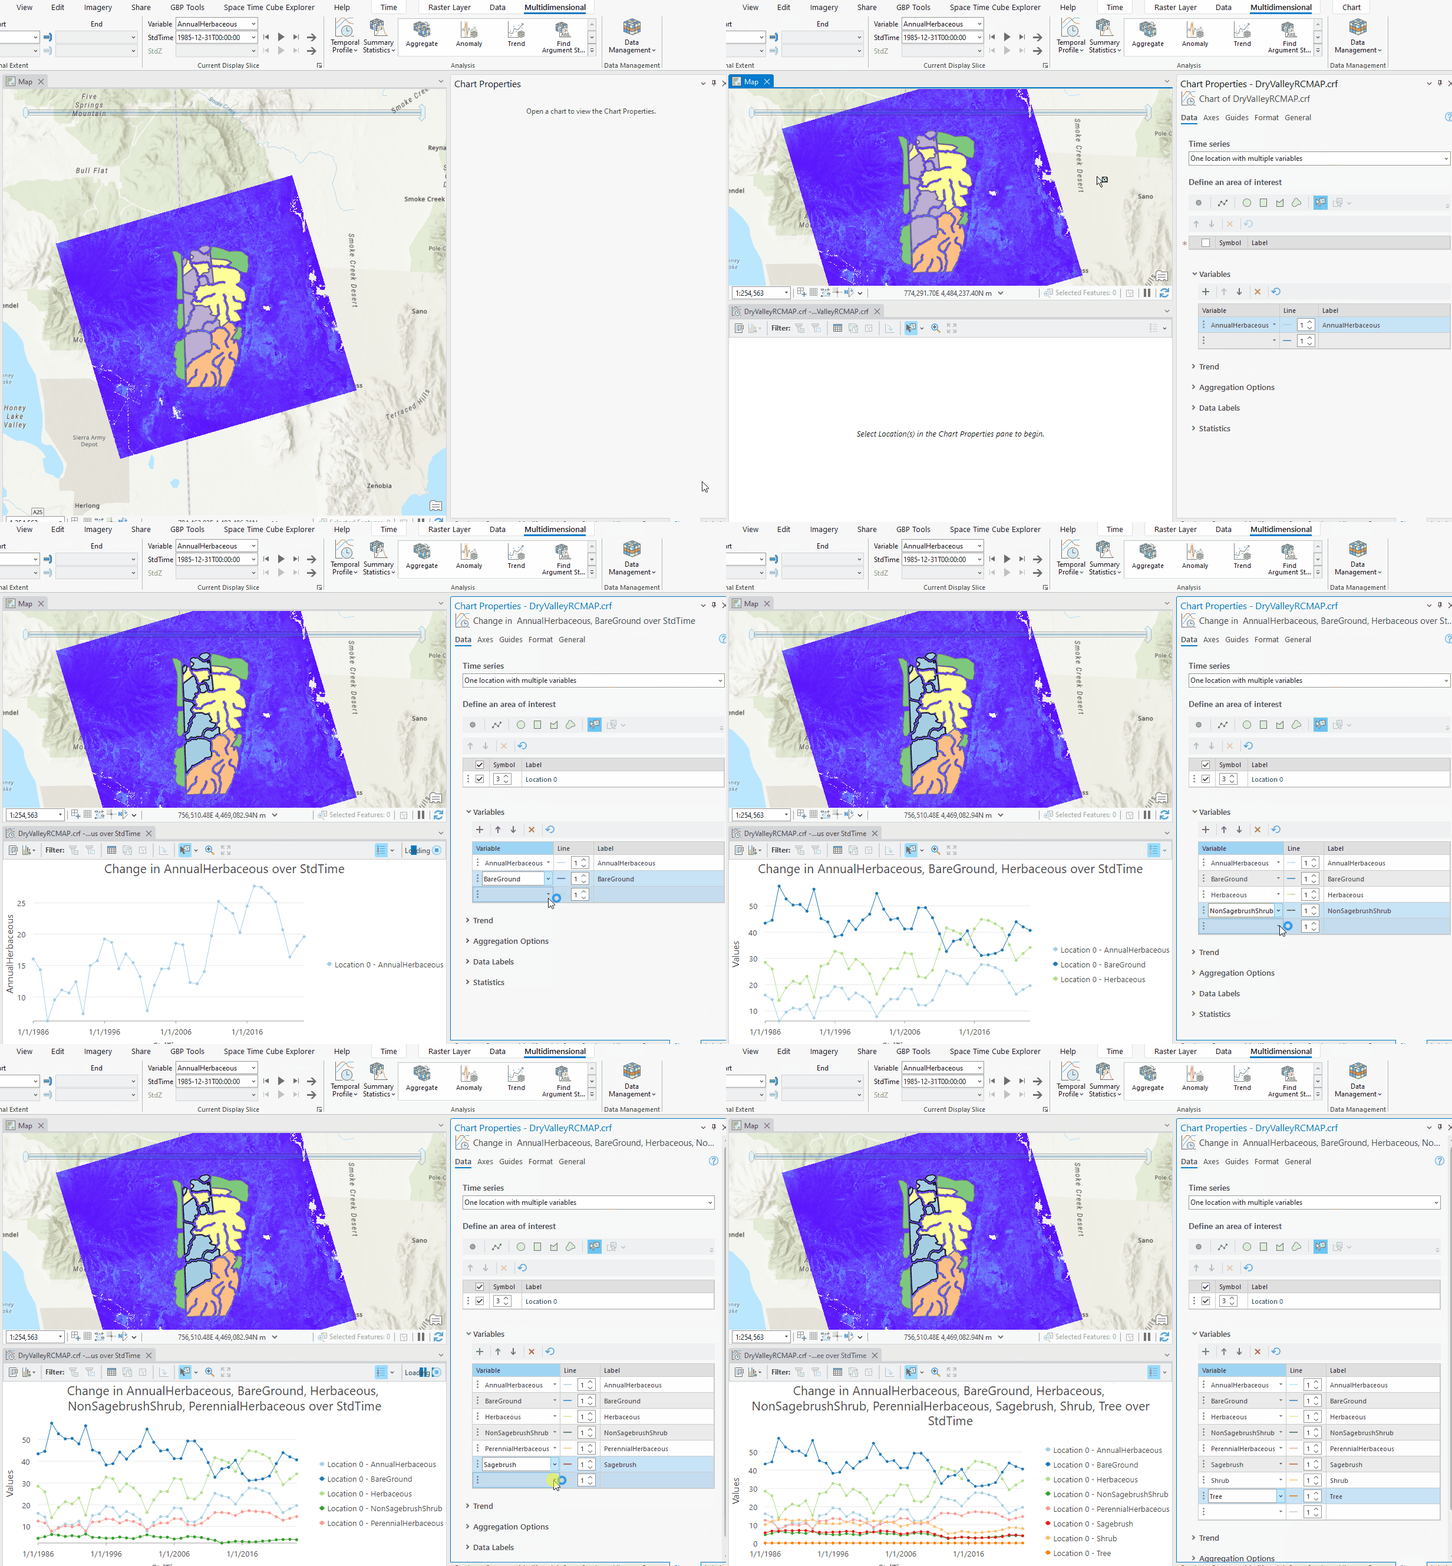
I now want to be able get a temporal profile in script for a given polygon to add to our reporting tool. So basically simulate the above gif and get back a SVG of the chart that I add to our larger PDF.
I am not finding a way in script. Is this possible?
I found the arcpy.raster one
temporal_profile(points=[], time_field=None, variables=[], bands=[0], time_extent=None, dimension=None, dimension_values=[], show_values=False, trend_type=None, trend_order=None, plot_properties={})
But it is not giving me anything and not sure how points fits in. I got a chart to display just giving it time but its blank.
Thanks a lot