Hello,
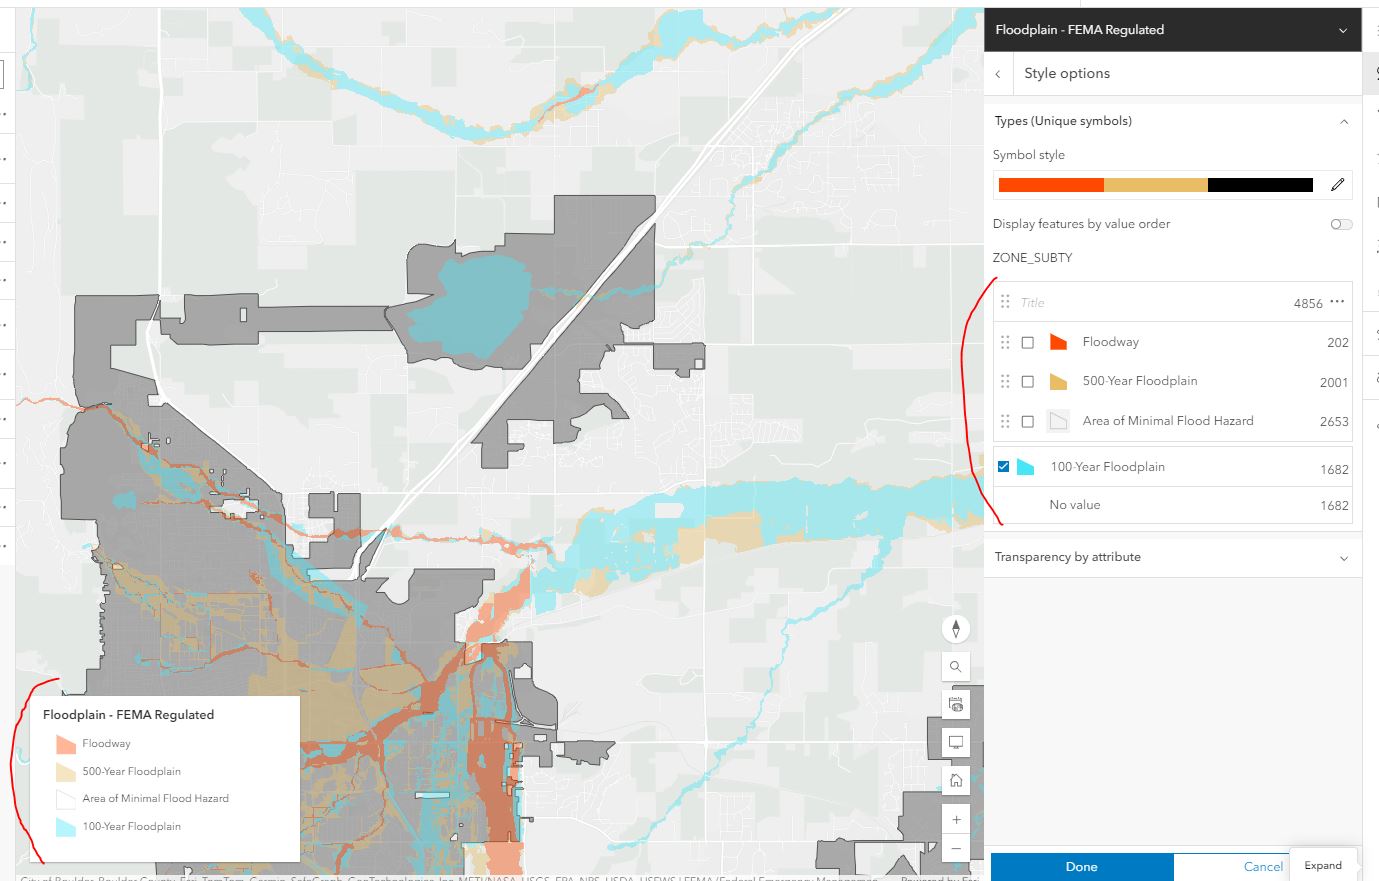
I have a web map that shows the FEMA-regulated Floodplain in my community. In the FEMA data, there is a Zone Subtype field that is used to classify features in the commonly-used categories of Floodway / 100-Year Floodplain / 500-Year Floodplain. This field has values for Floodway and 100-year Floodplain, but no value for 100-Year Floodplain.
I can symbolize each of these categories distinctly, however because the 100-Year Floodplain is "No Value", it doesn't seem that I can re-order it in the legend to show up where it logically should, between Floodway and 500-Year Floodplain.
I also do not appear to be able to suppress the "Area of Minimal Flood Hazard" - basically everything NOT regualted floodplain - from showing up on the legend. This does not need to be on the legend.
Is there any way to remedy this? The current layer list / legend looks ridiculous as-is. See the screenshot below for an illustration.
Two notes: The source of this data is a REST mapservice; I am using the "0" layer. I don't think there's any flexibility in this. Also, both FEMA and ESRI host this data which is somehow correctly symbolized, but I cannot use that as we have modified the FEMA data slightly, as we consider all floodplain above a certain elevation to be floodway.