Hello,
I am trying to generate a catalogue using map series along a pipeline. By making use of the strip map index tool, I can set up a layout page with views "along" the feature line that I want to describe. However I wish to add the local elevation profile, and with the use of a 3D line feature class, I managed to add a Profile Graph as a chart.
Adding this in my layout page, I can tick the option to only show what is within the extent of the map series shape. However, there are 2 big issues with this process :
1) The horizontal distance axis is set to 0 at the beginning of each page and I can't figure out how to leave the "absolute" KP distance.
2) On top of this, I can't seem to add data on this profile graph (e.g. if there are punctual features that I want to highlight such as crossing, structures, geohazards etc.)
I tried to change the graph type and use a line chart instead. I created a point feature class along the previous line and adding the Z information in a dedicated field, but this graph doesn't show data when I tick the "only show chart data visible in the map frame" : the window stays blank with a "Points" label in it. It only works if i untick the option to show local data AND if the map frame is zoomed out to show the whole line, which defeats the purpose of the map series.
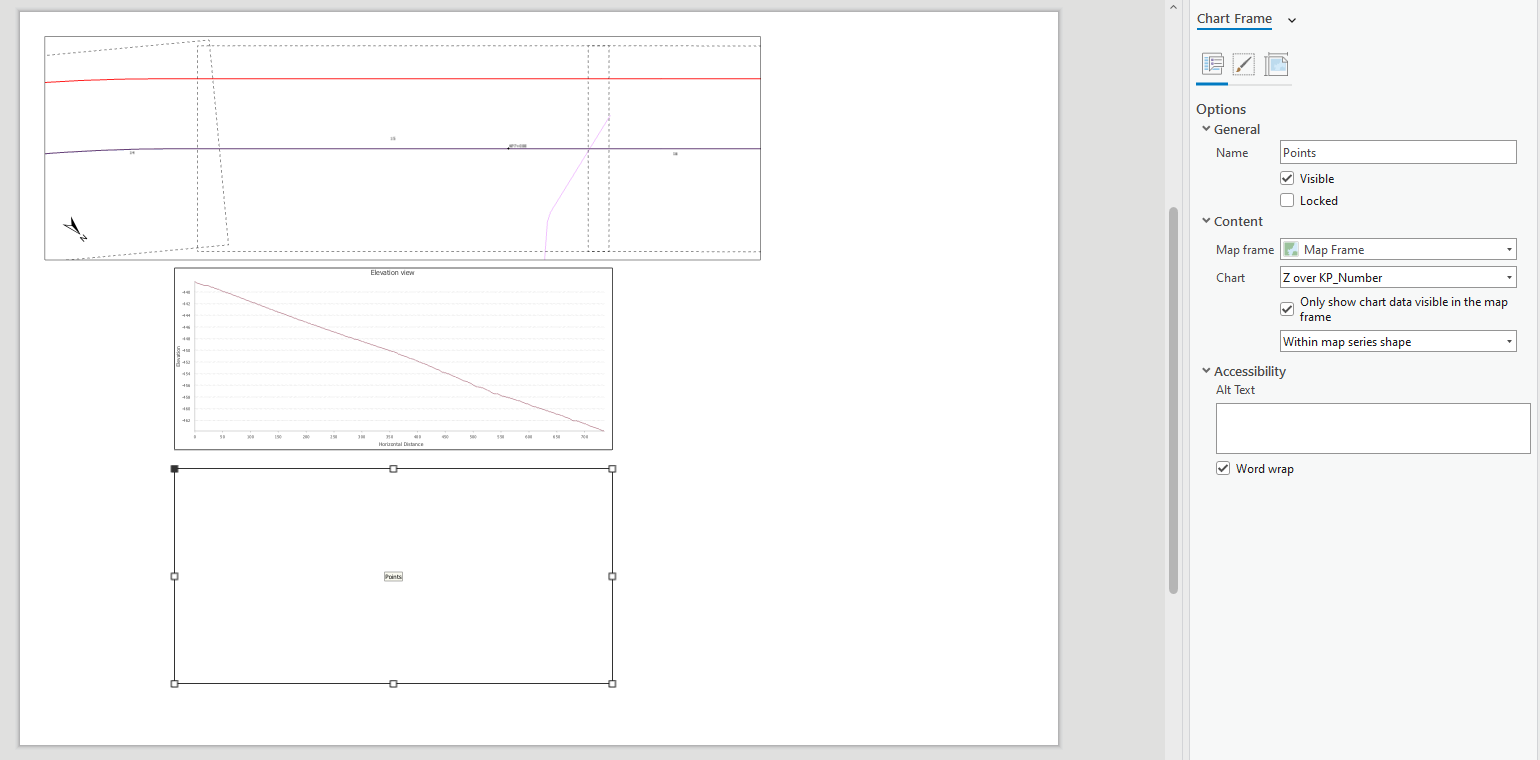
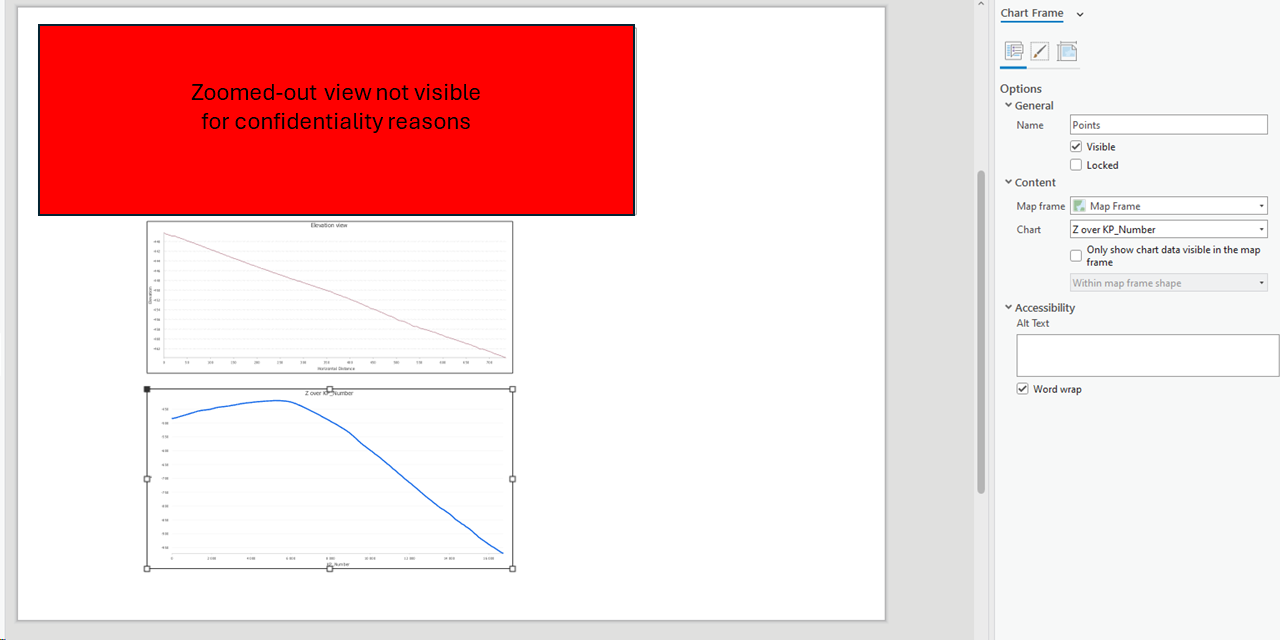
Has anyone tried to do something like this before?
Thanks for your help,
Adrien



