I am attempting to symbolize some survey123 results in Map Viewer. I have 8 attributes that I am basing the symbology on and using the pie chart symbol option in map viewer. Seen below
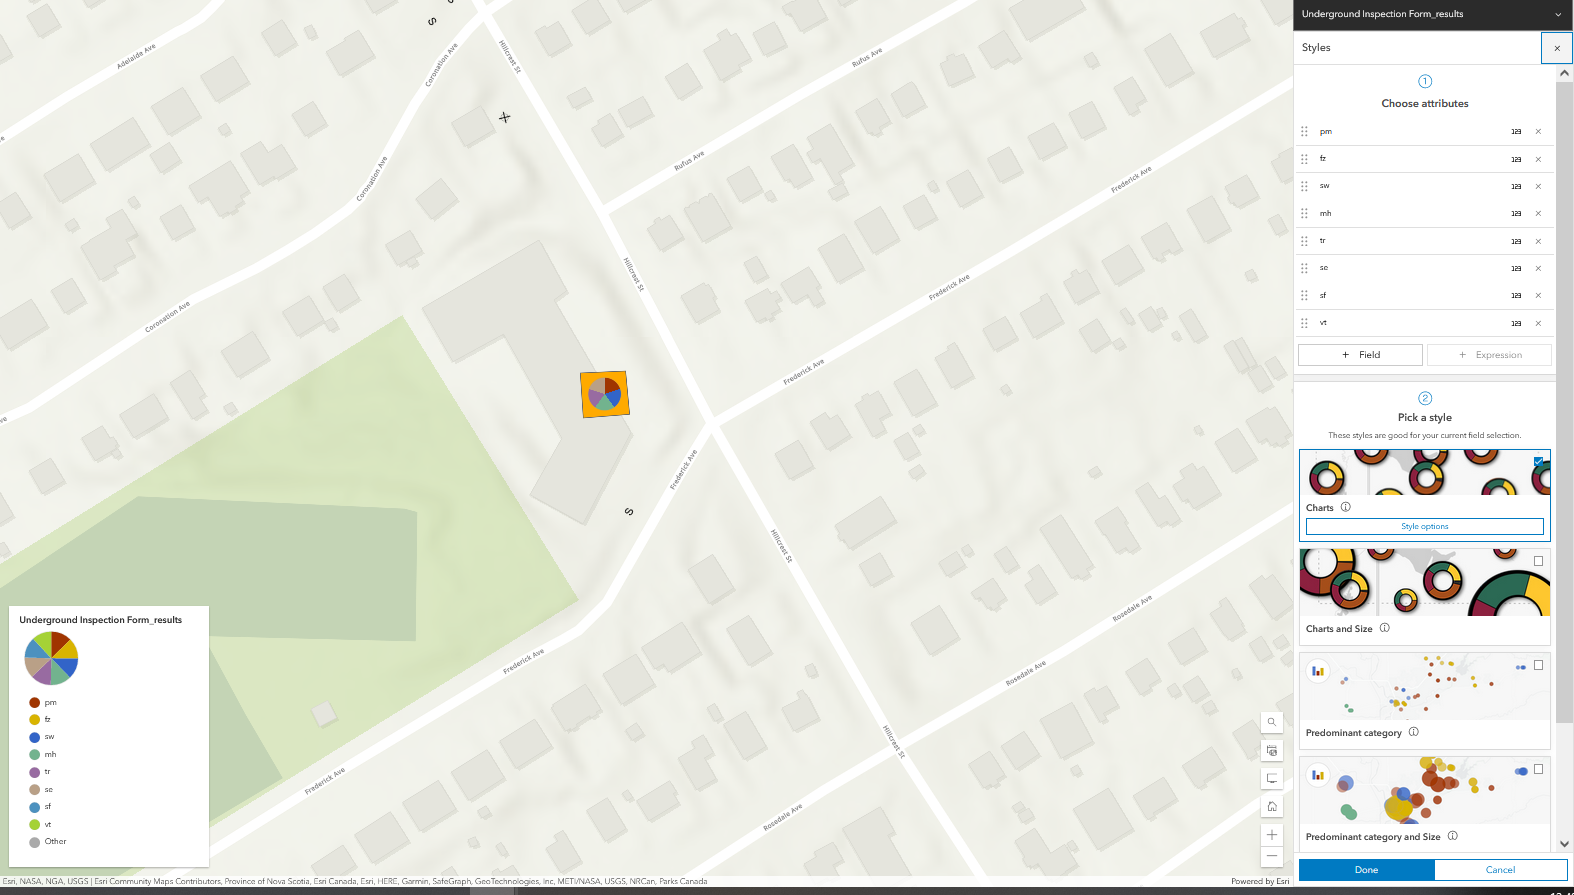
All that seems to be working as expected until I try to view the data in Field Maps. It simply does not display. There is no pop up, there is no symbol.
Is this symbology not usable in field maps?
The data I'm looking to symbolize on is in two forms within the survey, as a single select_multiple field which I attempted to use an arcade expression on but it seems AGOL arcade does not support the necessary functions to do this and as a integer field with each of the results of the select multiple broken out so to say. The later is what I used in the pie chart symbol shown above.
any insights would be appreciated, thanks

