Hello,
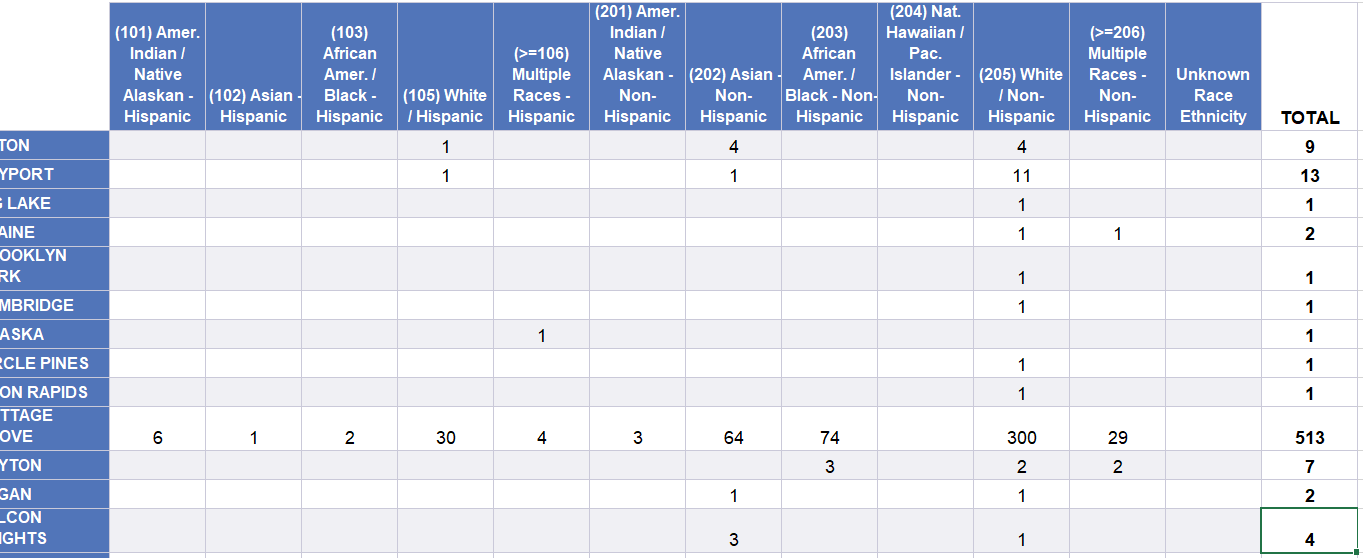
I have been given a spreadsheet that has counts based on services received in cities across our county. Is there a way if I apply a layer that has the geographic border of the county to then manually enter these counts associated with a city on the map to have dots based on the number of individuals receiving services? And taking it one step further could I do different colors by race/ethnicity or would I have to create a separate map for each R/E?
Dot density does not allow you to hand place the symbols. I believe the dots are placed randomly but it should place the number of dots that you have specified in your table (I would suggest reading through the documentation). You will need to transpose the information from your table into the attribute table of your cities feature layer/shape file.
Thanks. If I add a layer that simply has the boundary with no data points included, can I hand place the symbols/dots based on the size I specify in the certain cities?
I think symbolizing by Dot Density will do what you're looking for: https://pro.arcgis.com/en/pro-app/latest/help/mapping/layer-properties/dot-density.htm
Les membres connectés peuvent publier, suivre les mises à jour, et plus encore. Nouveau ici ? Inscrivez-vous gratuitement.
Find useful guides, FAQs, and documents to help you navigate and make the most of Esri Community.