I have created a dashboard for supervisors to monitor site safety inspections submitted from a Survey123 I have also created. Upon each inspection, a supervisor selects which members of staff are present from a multiple choice question in the form, with the aim is to have everyone inspected at least once per month.
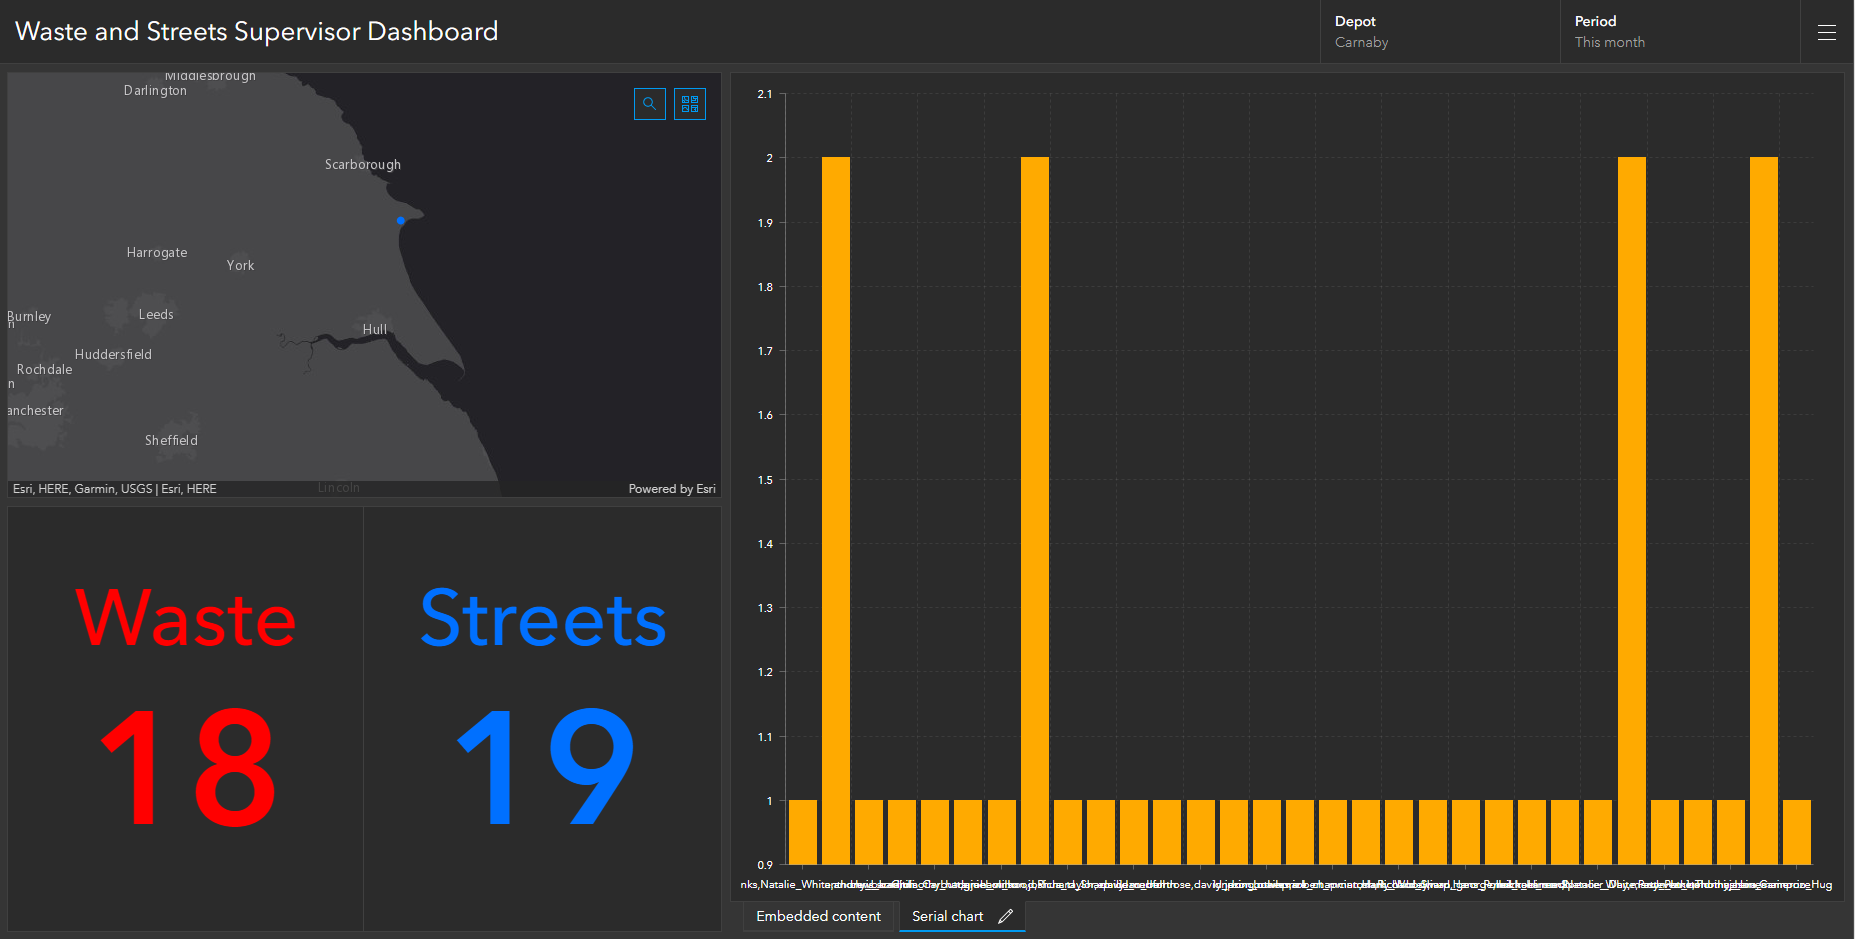
I'd like to include a graph (as above) to show any staff that have not received a site safety monitoring but, as the serial chart widget only shows those with a value against them, it only shows staff that did receive an inspection.
The analyse tab on the Survey123 form does what I need perfectly and so the only work around I could find was to embed that page into the dashboard:
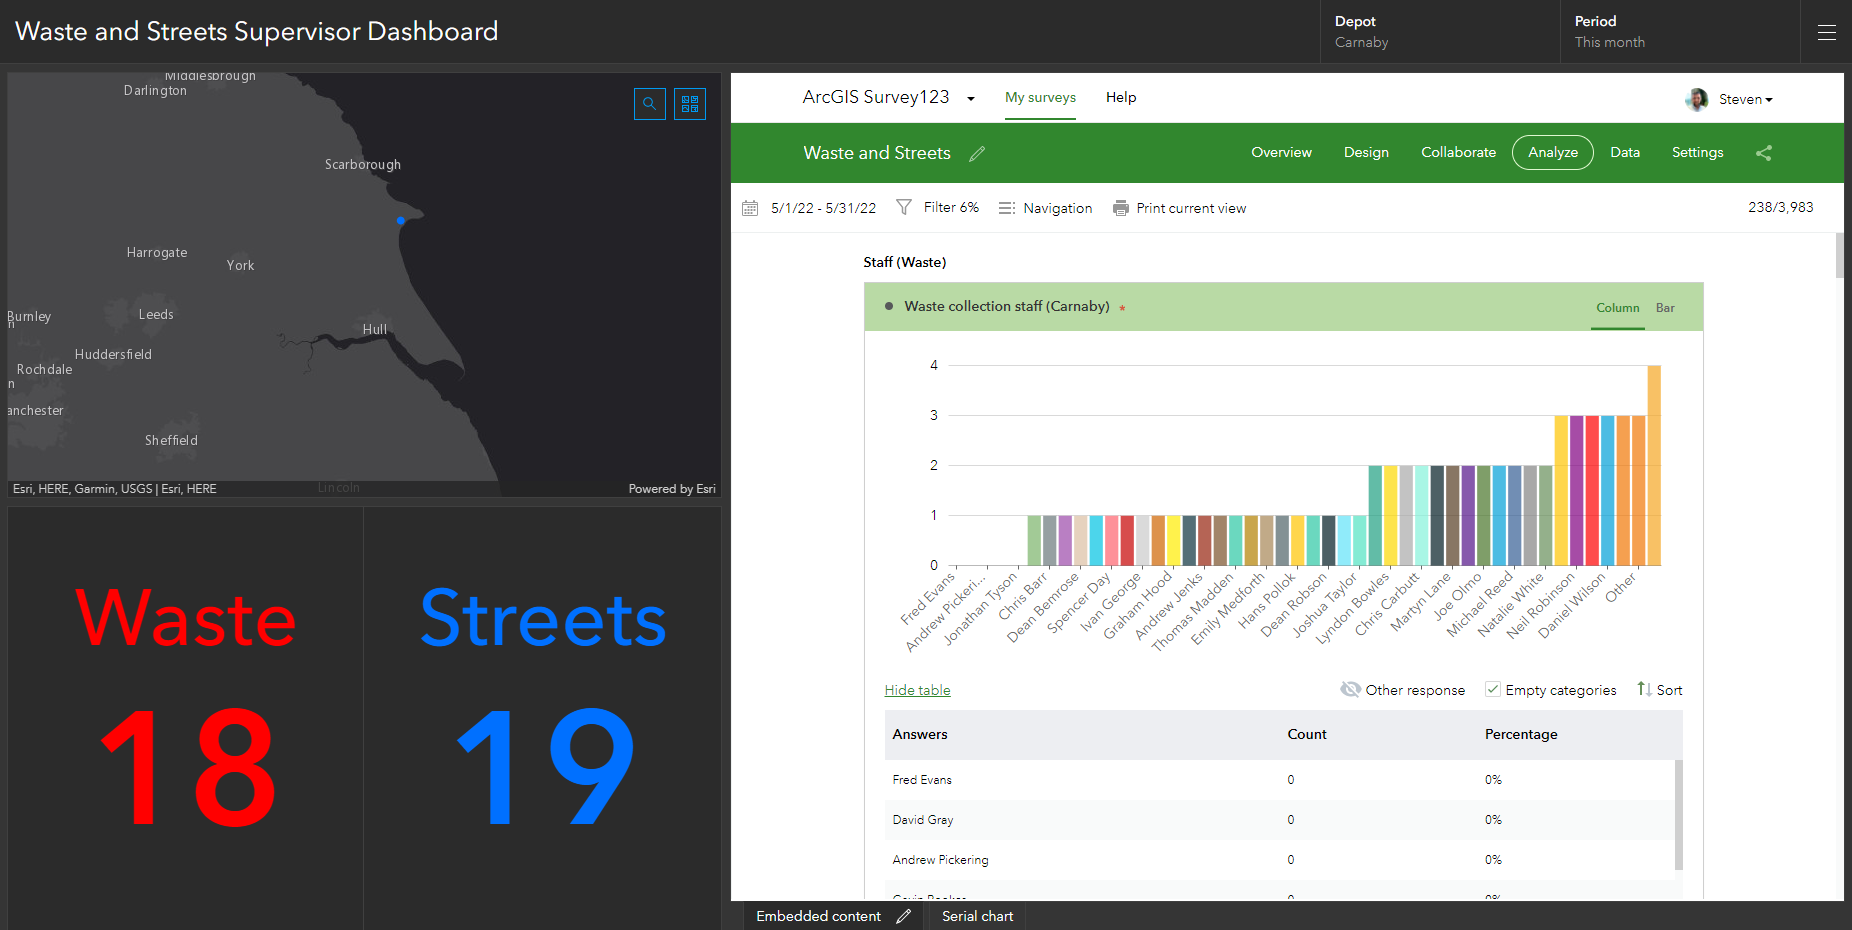
However this isn't ideal as it can take a while to load the embedded webpage. The supervisor is also required to enter the specified date manually each time and hide/unhide questions so that they only see the relevant graph, and not the other questions within the survey.
Is there a way for the serial chart widget to show what I am after without using a data expression, or any other form of coding? I've no experience of doing either.


