Hello,
I am trying to build a vehicle inspection survey based on the ESRI Sample. The problem I'm having is that I would like to have the vehicle items inspected to populate a Chart in the Ops Dashboard with the condition of the items showing up as a Stacked chart (i.e. stacked bar graph) so that the Good and Bad conditions are shown side by side that will show a trend line as more inspections are collected. This way you will be able to see at a glance if an item is having more Good or Bad inspections over time.
The problem I'm having is that I can't get the data to collect into the correct fields to actually be able to summarize it in the Ops Dashboard. The data needs to be in 2 fields - Item & Condition. But it also needs to be easy for data collection. Using the sample provided by ESRI doesn't work since each item is its own field and can't be aggregated as attributes of the inspection record.
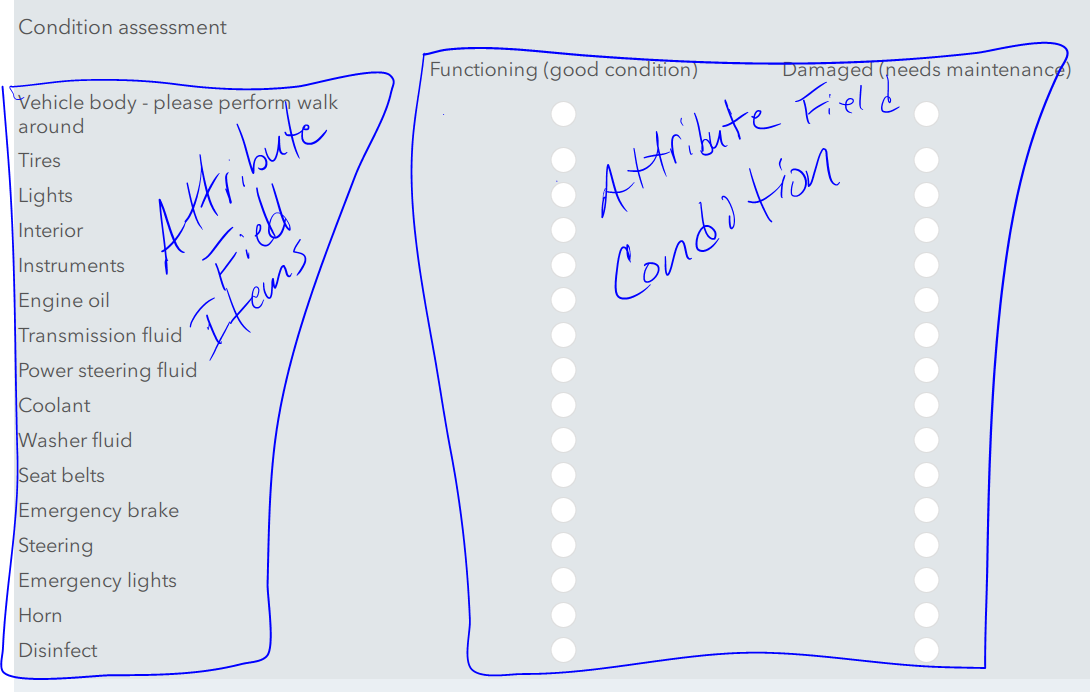
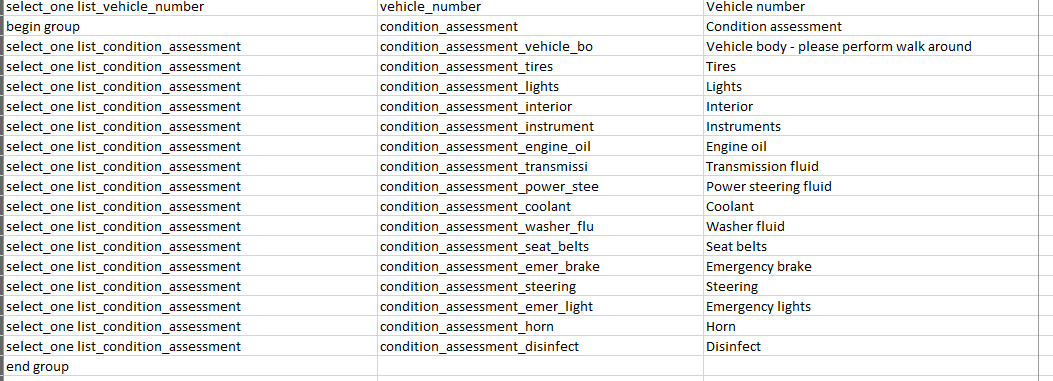
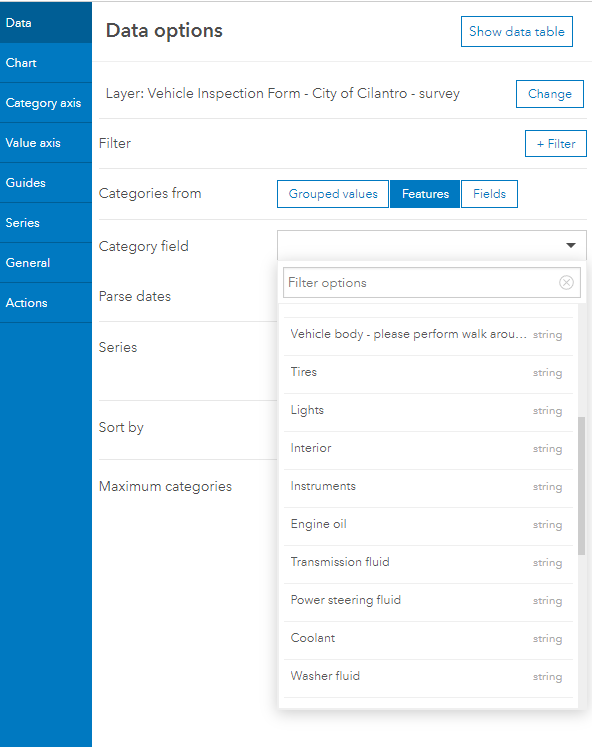
As shown below, when you go to add the data as the source for the chart in the Dashboard, you can only select 1 inspection item to display its condition. I want to use the Item category field and split it by the Condition field.
Any suggestions on how to format the Survey form to allow the data to be collected in 2 attribute fields while still making it as easy to enter as the Single Choice Grid format? I've tried a bunch of Survey options but can't seem to get it to work the way I want. I don't want to do a Repeat since the submitter will miss items or lose track of what they've done by choosing 1 item and condition at a time. Ideally, the format would look like the Single Choice Grid, but the data structure on the back end would be 2 fields pulling from the list of inspection items and conditions.
Thanks,
Andy