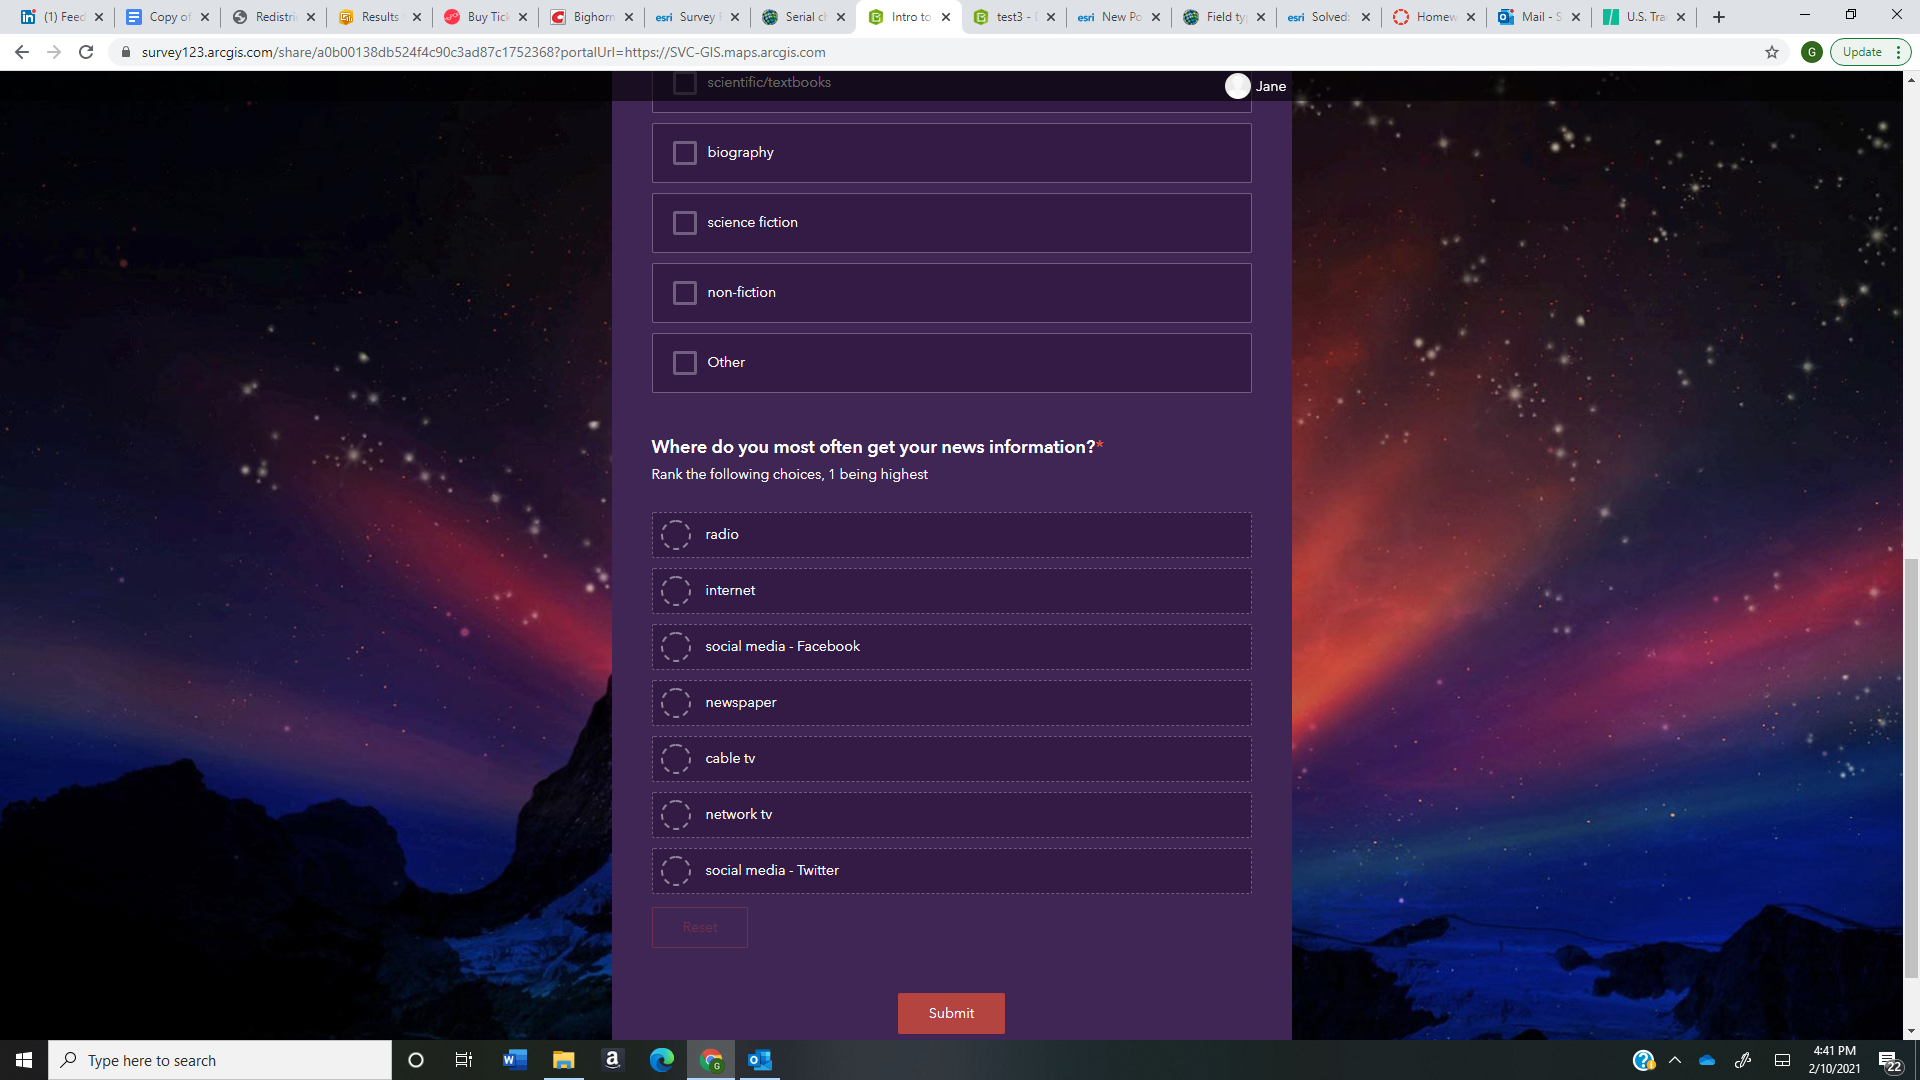
Hi. I am a GIS Instructor at a local community college. I created a simple "welcome to GIS class" survey for my community college students this quarter, using Survey123, and have linked those responses to a Dashboard. However, one of the questions, which was a Ranking type in Survey123, generated a coded string answer for each of the respondents. Screenshot of my last survey question (which was "Where do you most often get your news information?":
So, when I pull the answers into Dashboard, in a Serial Chart, it looks something like:
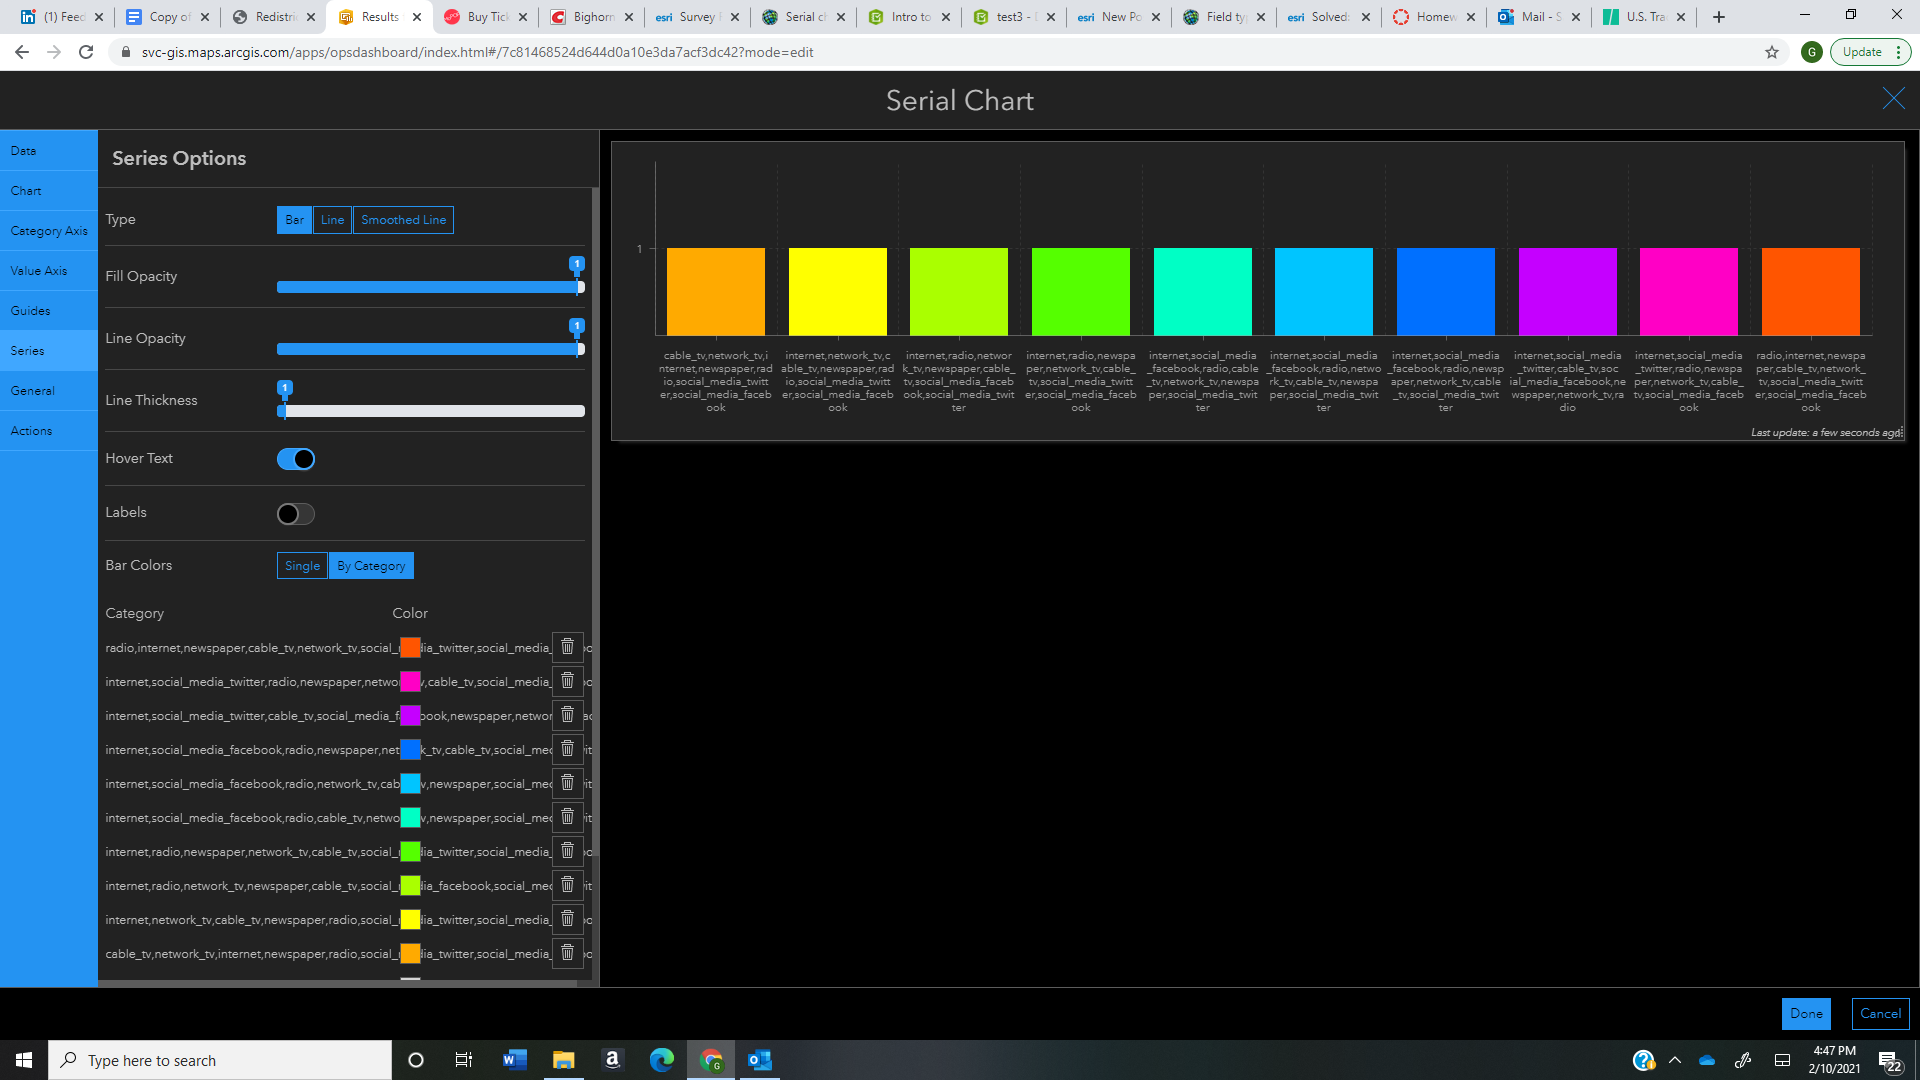
Each of the 10 survey respondents had a different way of ranking the choices, so each answer is unique. But, what I was hoping to do with this question, was display how many people chose one of the answers, say "internet" as their top choice, or what was the overwhelming least favorite answer?
The only way I can think of to display these answers is in List form, but that is also very underwhelming/confusing and doesn't allow for analysis. Thoughts? What am I missing?
I want to know if I should tell my students to avoid using Ranking questions for their Survey123/Dashboard assignment coming up...
Thanks,
Sarah

