I have been working with ArcGIS Dashboards for the past year, but I finally decided to dip my toe into the world of Arcade this past week. I am trying to use Arcade to accomplish two tasks on the same ArcGIS Dashboards list:
1) look up the acreage of a parcel in a field and either show text "size not reported" or a formatted version of the acreage depending on the value (-999 indicates the size was not reported)
2) format the background color of each item in the list based on the access status of that parcel (values range from 1 to 5)
After a bunch of googling and hacking away, I was able to produce code which accomplishes both tasks. However, only the first task displayed in the Advanced formatting winds up getting applied:
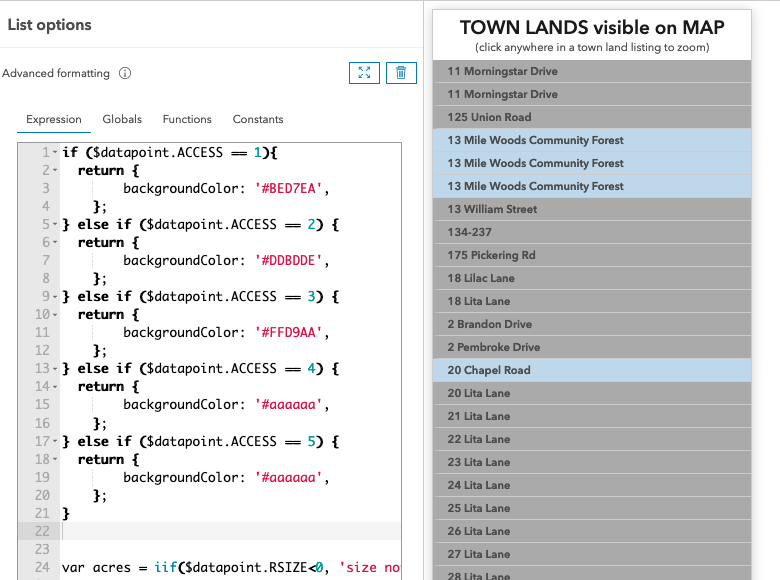
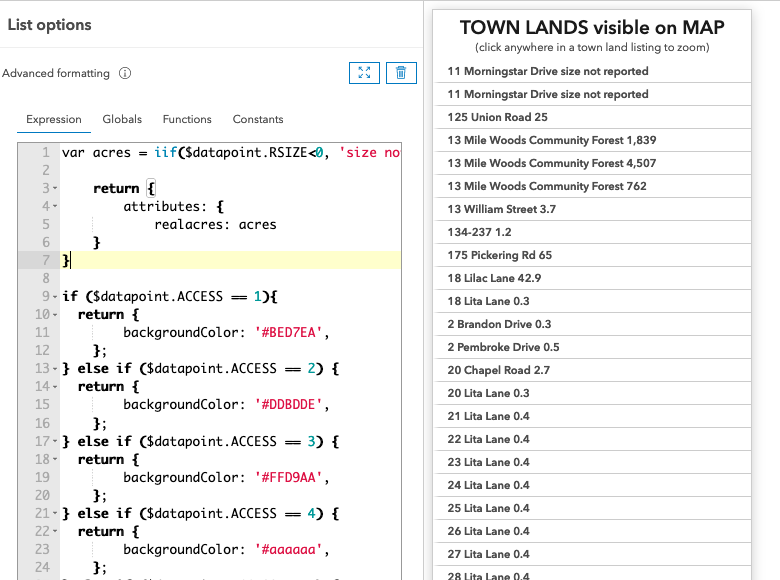
It seems to me that something in my formatting is causing the reading of the code to stop at the end of whatever section of the script is on top. I tried looking at many examples that Esri and others provided, but I just can't figure out what is happening. I tried removing and adding brackets, but nothing I've tried has solved the problem.
I realize that I am likely missing something simple, but I'm all out of ideas about how to troubleshoot on my own. Any advice / suggestions would be greatly appreciated!
Thanks so much - Shane
In case it's helpful, here's the code:
if ($datapoint.ACCESS == 1){
  return {
        backgroundColor: '#BED7EA',
    };
} else if ($datapoint.ACCESS == 2) {
  return {
        backgroundColor: '#DDBDDE',
    };
} else if ($datapoint.ACCESS == 3) {
  return {
        backgroundColor: '#FFD9AA',
    };
} else if ($datapoint.ACCESS == 4) {
  return {
        backgroundColor: '#aaaaaa',
    };
} else if ($datapoint.ACCESS == 5) {
  return {
        backgroundColor: '#aaaaaa',
    };
}


var acres = iif($datapoint.RSIZE<0, 'size not reported', Text(Round(Number($datapoint.RSIZE),1),"#,###.#"));

    return {
 	    attributes: {
            realacres: acres
 	}
}

