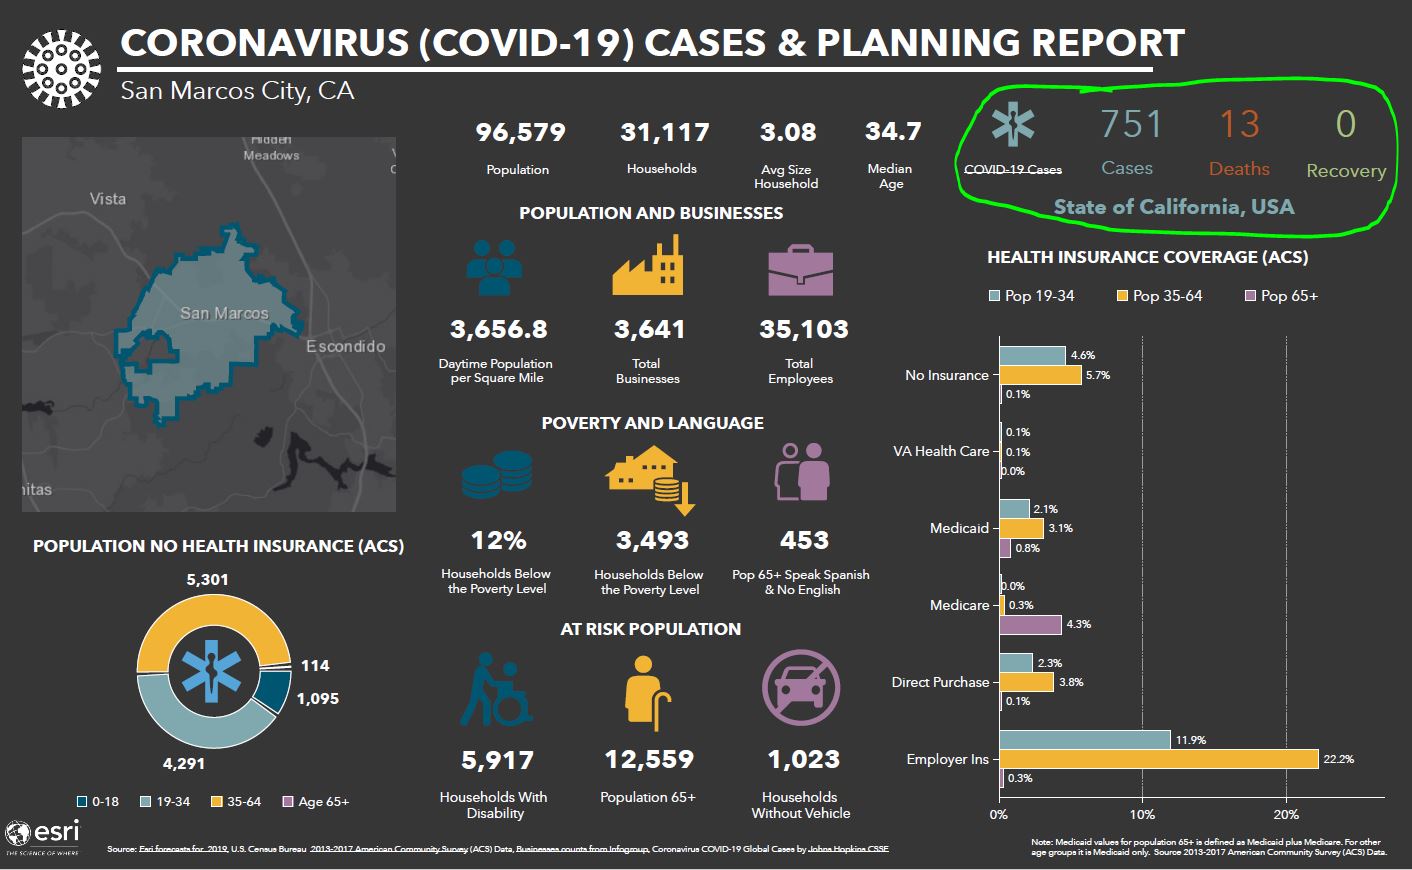
I generated an infographic as part of a local government response to the COVID-19 pandemic. It would be great to use demographics data for my municipality (city) and provide COVID-19 cases/deaths/recovery figures based on the most detailed geography available.
Esri did an amazing job providing templates and resources for public sector agencies to provide public information and resources in response to COVID-19. However, it would be very helpful to build some flexibility into the template as more detailed information becomes available. Manually added case information in image below - circled in green.
For example, only state-level data was available early on. We now have access to county-level data, which is a welcomed improvement. It would be great to see flexibility added to COVID-19 (and other) BAO infographic templates in future releases.