F ree basic functionality.
I use Free as both a verb and an adjective.
The examples I will be providing should be Free(d) and should not require an Advanced or Standard License... they should be Free with a basic license.
History
Frequency .... the help topic
It started a long time ago with Split Layer By Attributes.
Advanced license for so long, when really... the means to provide the analysis were already there. Eventually, it was Free(d).
So this will be a series on how to perform functionality using the tools that are already provided for you within ArcGIS Pro and supplemental Python Packages which are already installed.
Maybe some educators out there will take application development directed towards analysis as a serious area of GIS.
Tools to demonstrate
This blog series will NOT be about making maps or stuff related to expedite map making. So if you want to develop tools for map making, then look elsewhere.
I will begin with tools in the Analysis and Data Management Tools, for example:
- Analysis Tools
- Thiessen Polygons … Thiessen Polygons in ArcGIS Pro (Actually, I have done several incarnations of spatial triangulation and allocation already... nobody notices...)
- Data Management Tools
- Frequency … Frequency tool (Ditto, One exists on the code sharing site but this is a beefed up version)
Example of Frequency and Statistics
If you had 4 counties with 4 towns of various size classes and you were interested in studying age dynamics versus population size, you might want to start with that basic premise.
- Classify/group/categorize the towns by population size
- Produce a unique classification scheme or use 2 or more existing fields to group your data for counting (aka, frequency).
- Now, that the data are grouped, you can now determine some basic statistics for those classes.
Output example
See the table as an example... A table is as good as a map and you don't get distracted by all those colors.
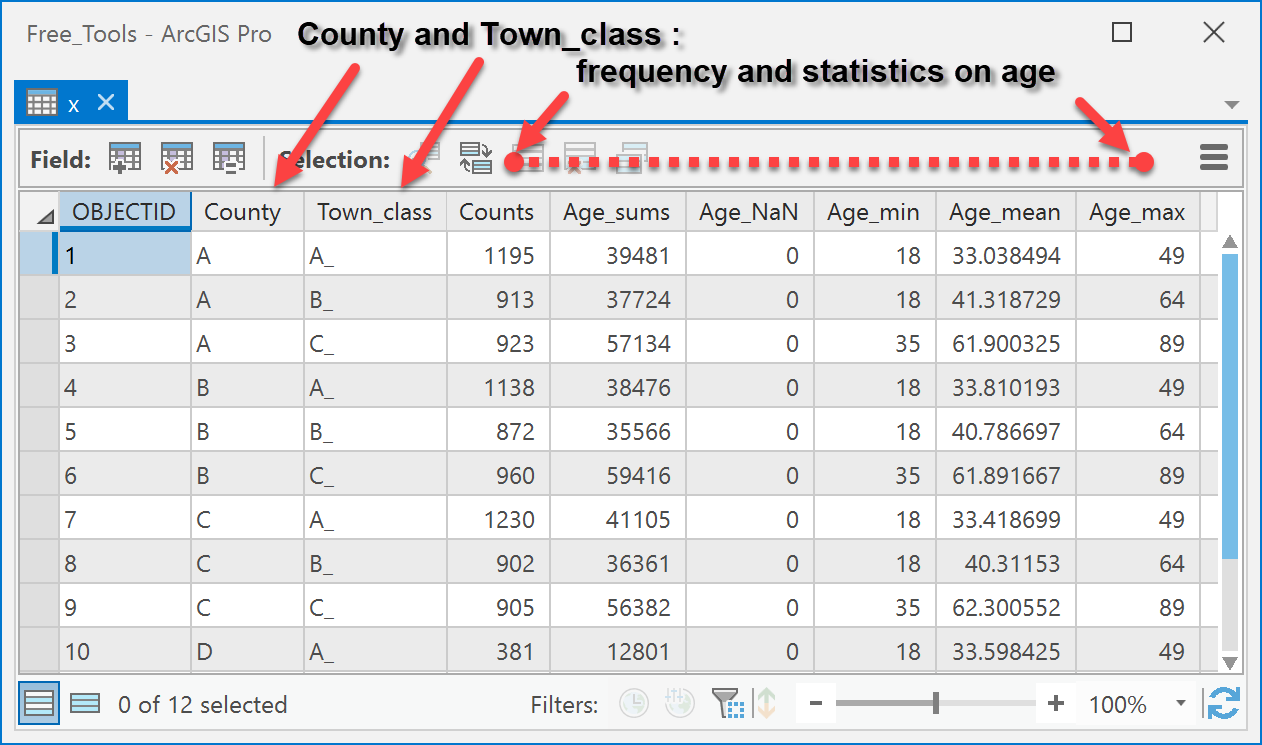
So, row 1, County A, Town_class A_.... 1195 people, some stats... Age_min will not be below 18... pretend, survey privacy.
A little Chi-Square, perhaps a Moran's (if we wanted to map) and off you go.
Sadly this is in an Advanced license. The whole production of the classification scheme, the frequency determination and the sorting is basically 1 line of code. The stats stuff? python and numpy. Null values? handled with ease... besides you should never have nulls anyway.
Requirements
So download and try it out on your data.
I would be interested in use cases to see what might be added.
The only restrictions...
- ArcGIS Pro 2.4+ (might work on lower versions, but I no longer have them, and these are free anyway)
- Locally stored data in a file geodatabase, like gdb tables or featureclass tables
- If you have excel or csv files... do the work and make them gdb tables (there are tools for that, check ArcToolbox or my blog)
- I embedded the script into the toolbox, let me know if it doesn't work embedded. When I finish with suggestions for additions, I will Free the script so you can make your own modifications or additions
Have fun.
Up Next
Extent to Polygons Converting feature extent(s) to polygons is a relatively easy task
