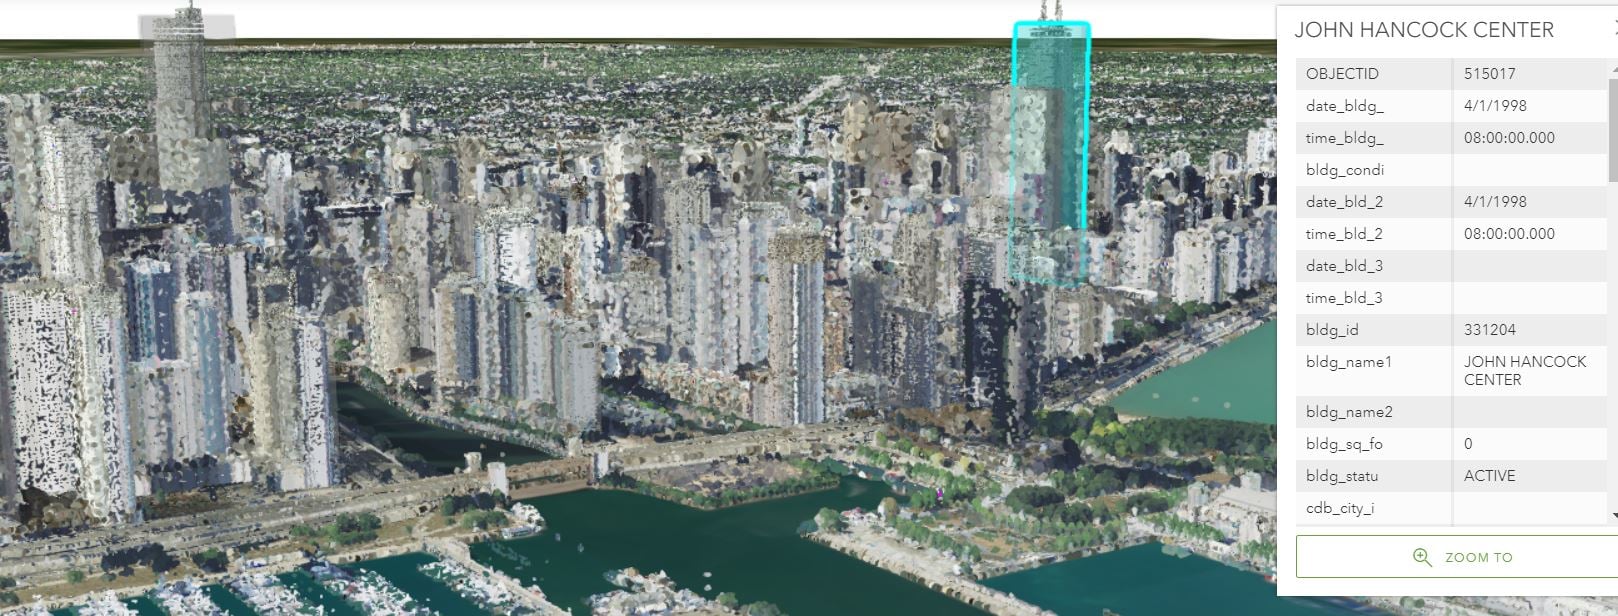
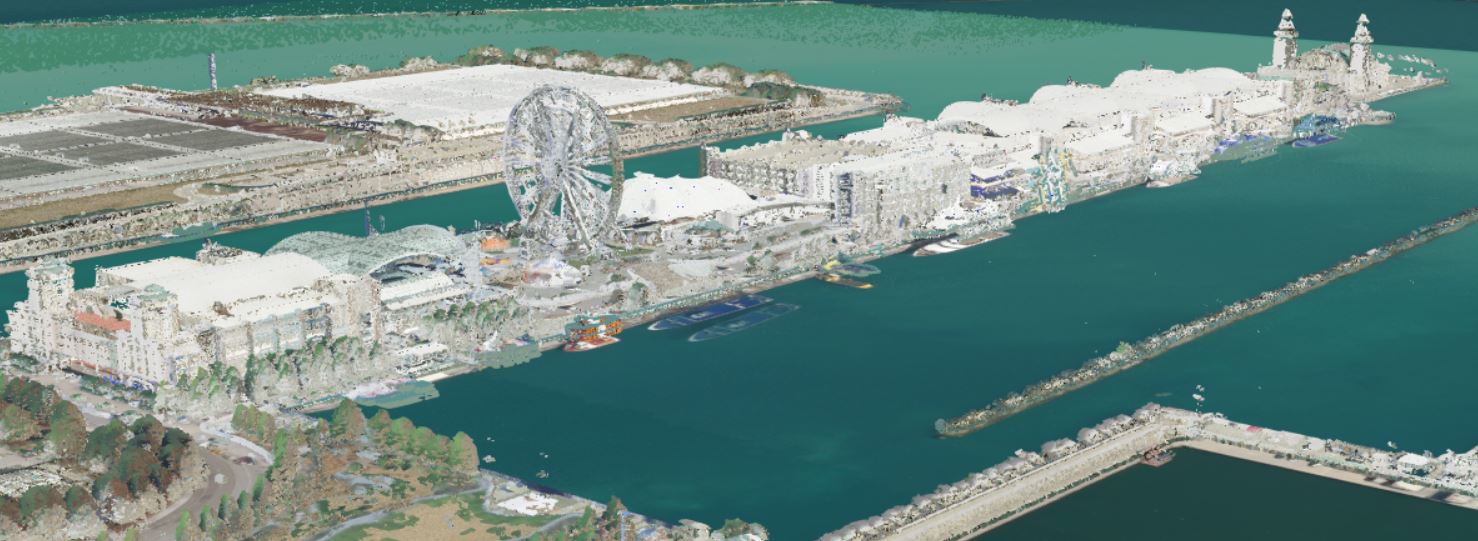
Este blog está en desarrollo, recién comenzando y crecerá con el tiempo:<\/STRONG><\/P><\/P>En los últimos años, he estado publicando nubes de puntos lidar colorizadas como suplementos a las ciudades 3D, como área de St. Louis<\/A>, que he creado usando la solución 3D Basemap y extrayendo edificios del lidar. Sean Morrish escribió un maravilloso blog<\/A> sobre la mecánica de publicar lidar. Últimamente, he investigado el uso de las nubes de puntos lidar colorizadas como una forma efectiva y relativamente económica de crear 3D Basemaps. Tiene algunas ventajas ya que la mayoría de los estados, condados y ciudades ya tienen lidar disponible, la mayoría tiene imágenes de alta resolución y todos tienen imágenes NAIP que se necesitan para crear estas escenas. <\/P><\/P>Escenas lidar del Condado Manitowoc:<\/STRONG><\/P>Algunos condados, ciudades y estados ya están haciendo esto. El Condado Manitowoc, WI., tiene una Nube de Puntos LiDAR 3D<\/A> y también está creando escenas<\/A> con los datos. El Condado Manitowoc también hizo un gran story map mostrando cómo su lidar se usa como una nube de puntos lidar colorizada <\/SPAN>aquí<\/A> y recomiendo mucho echarle un vistazo. <\/SPAN><\/P><\/A><\/P>El StoryMap muestra con un video cómo capturar distancias verticales, horizontales y directas de superficies terrestres LiDAR en cualquier ubicación del condado. Cómo obtener mediciones detalladas de pequeñas características superficiales LiDAR como la profundidad de zanjas hacia la carretera. <\/P><\/P>Mida distancias en nubes de puntos LiDAR relativas a superficies terrestres LiDAR usando techos de casas como ejemplo para ver la altura del edificio.<\/P><\/P>Aquí está una capa de escena de Edificios Manitowoc donde tuvieron la idea creativa de usar el mismo lidar colorizado para dar lados falsos a los edificios mostrando el lidar clasificado como edificios varias veces, cada uno con una elevación ligeramente menor cambiando el desplazamiento en la simbología. Más adelante en el blog, muestro cómo hacer esto.<\/P>
<\/P>
Escenas lidar del Condado Manitowoc:<\/STRONG><\/P>Algunos condados, ciudades y estados ya están haciendo esto. El Condado Manitowoc, WI., tiene una
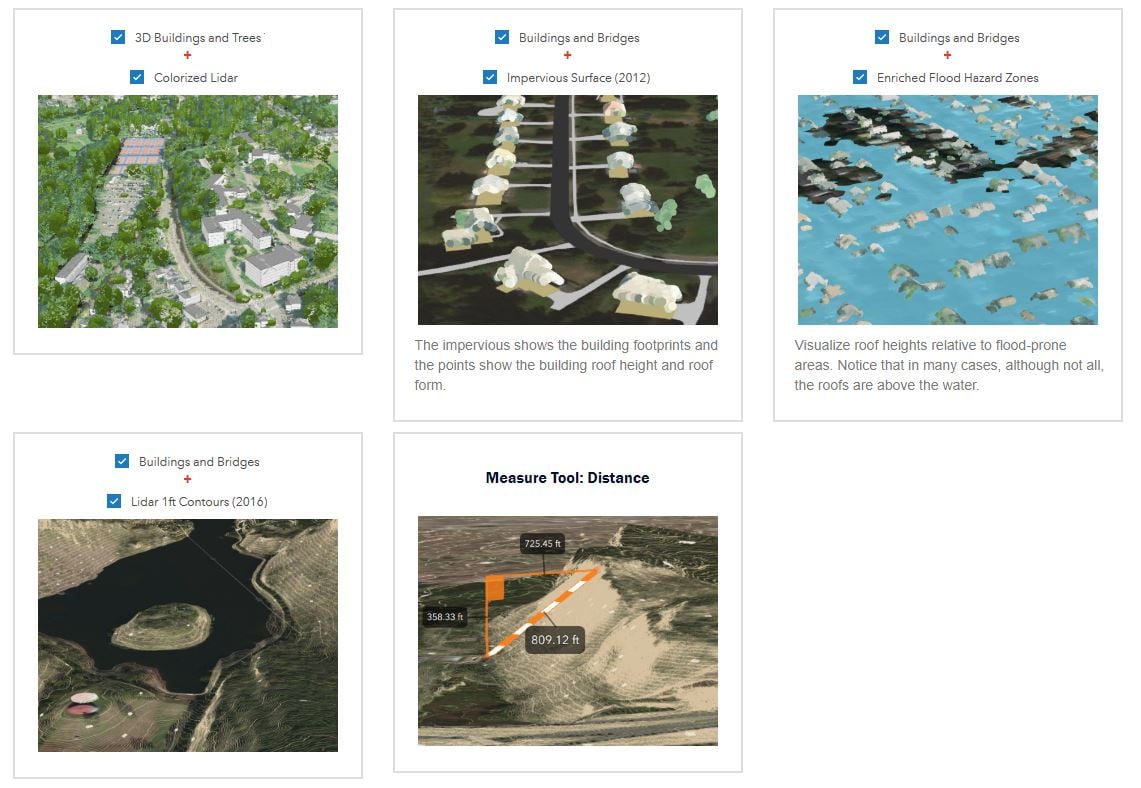
El StoryMap muestra con un video cómo capturar distancias verticales, horizontales y directas de superficies terrestres LiDAR en cualquier ubicación del condado. Cómo obtener mediciones detalladas de pequeñas características superficiales LiDAR como la profundidad de zanjas hacia la carretera. <\/P>
Mida distancias en nubes de puntos LiDAR relativas a superficies terrestres LiDAR usando techos de casas como ejemplo para ver la altura del edificio.<\/P>
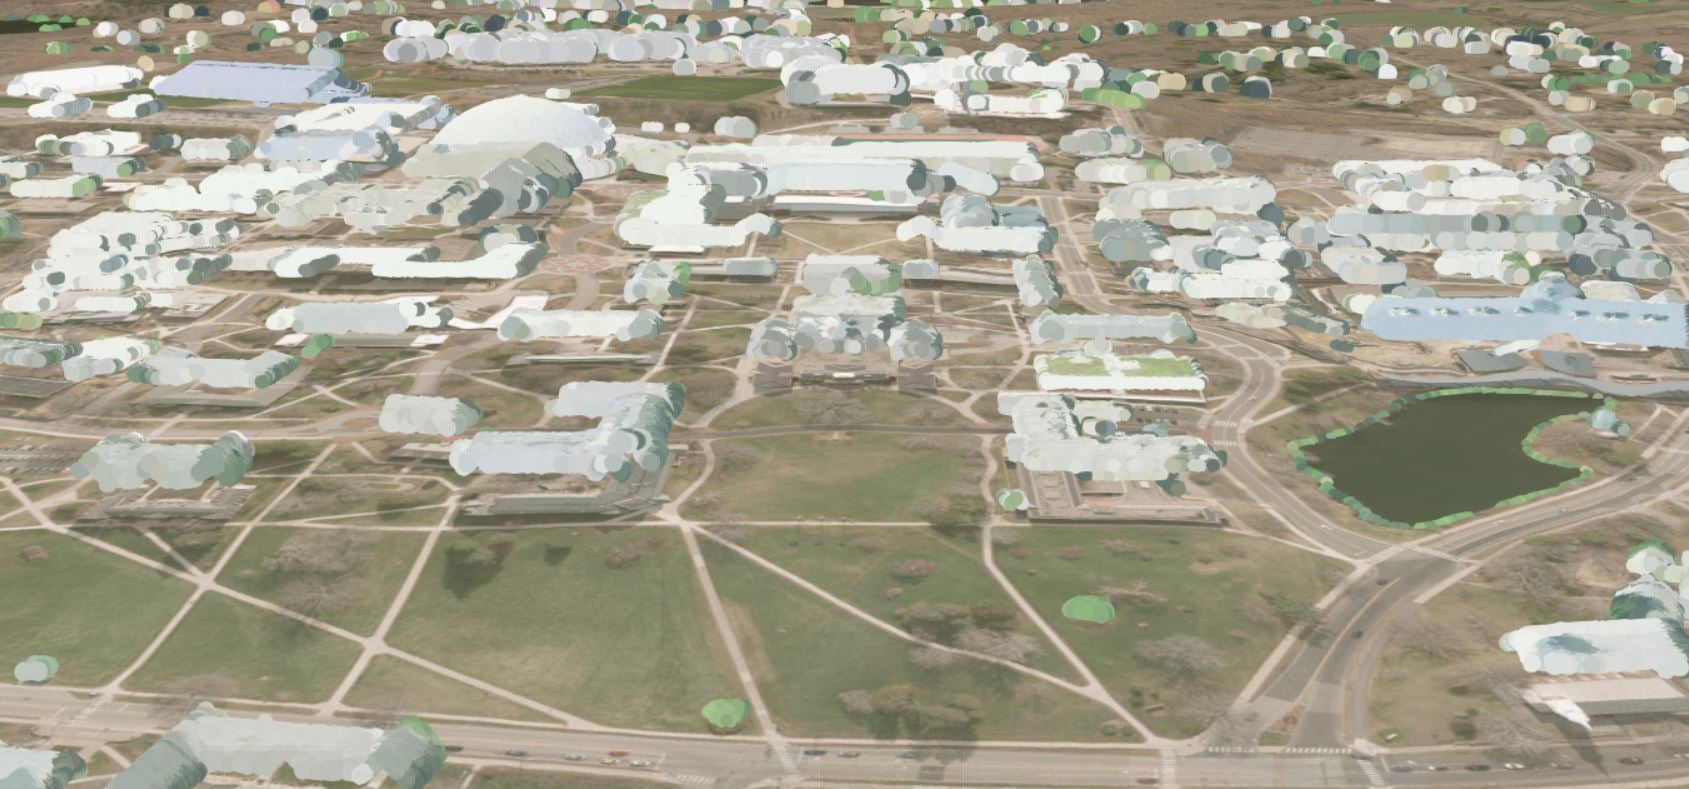
Aquí está una capa de escena de Edificios Manitowoc donde tuvieron la idea creativa de usar el mismo lidar colorizado para dar lados falsos a los edificios mostrando el lidar clasificado como edificios varias veces, cada uno con una elevación ligeramente menor cambiando el desplazamiento en la simbología. Más adelante en el blog, muestro cómo hacer esto.<\/P>
Mis respetos a Bruce Riesterer del Condado Manitowoc que juntó todo esto antes de retirarse, incluyendo la idea de usar los puntos del edificio múltiples veces con diferentes colores para mostrar los lados de los edificios y ahora trabaja para la industria privada, vea su nuevo trabajo en
Aquí hay varias vistas usando diferentes simbologías y filtros en la nube de puntos lidar publicada para Connecticut.Colorizado con NAIP:
Código Clase modulado con intensidad: La Intensidad Modulada permite que las elementos aparezcan como carreteras, aceras, detalles en techos y árboles.
Elevación modulada con intensidad:
Color filtrado para mostrar edificios:
Aquí algunos ejemplos de cómo mostrar desde su blog:
Alta Resolución con Hojas:<\/SPAN><\/SPAN><\/P><\/SPAN><\/P>NAIP con Hojas:<\/SPAN><\/P><\/SPAN><\/P>Alta Resolución sin Hojas:<\/SPAN><\/P><\/SPAN><\/P>A veces, imágenes coloridas de otoño antes de que caigan las hojas pueden ser geniales para escenas, pero todo depende de lo que quieras mostrar.<\/SPAN><\/P><\/P>Forma de agregar árboles con ramas y puntos como hojas:<\/STRONG><\/P>Aquí hay una prueba que hice usando la simbología Dead Tree para representar el tronco y las ramas, mientras que las hojas provienen del lidar colorizado. Mi herramienta Trees from LIdar o las herramientas de árboles de 3D Basemap Solution pueden crear los árboles a partir del lidar y luego los puntos pueden simbolizarse con el símbolo Dead Tree. Esta imagen fue hecha en ArcGIS Pro, no en una escena.<\/P><\/P><\/P>Visor 3D de la Ciudad de Klaipėda (Lituania):<\/STRONG><\/P>La
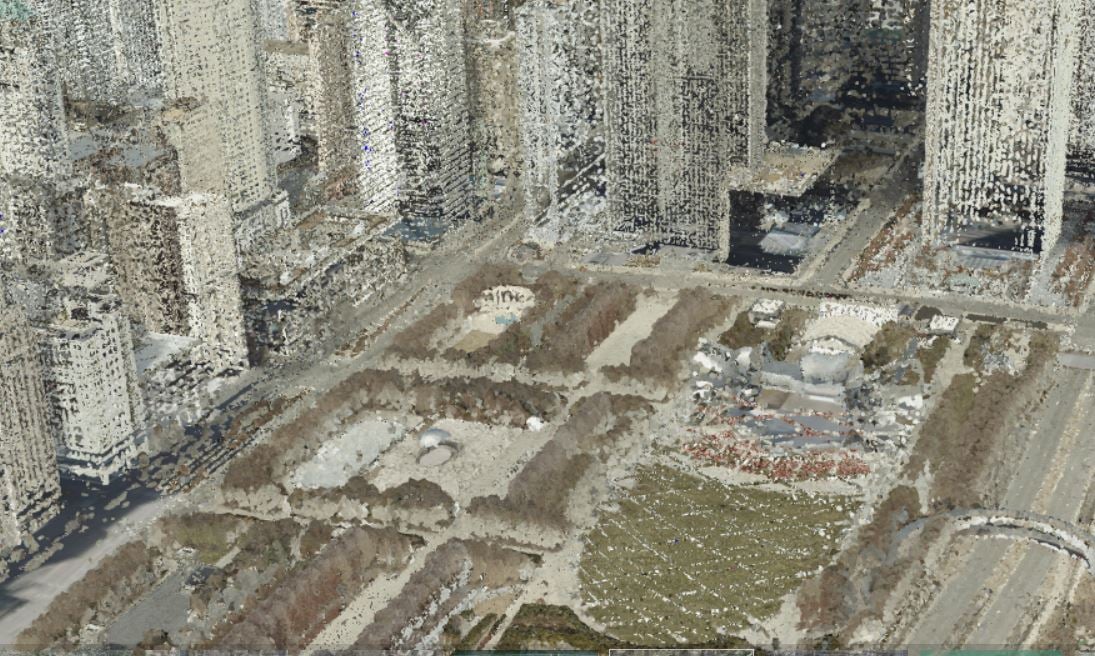
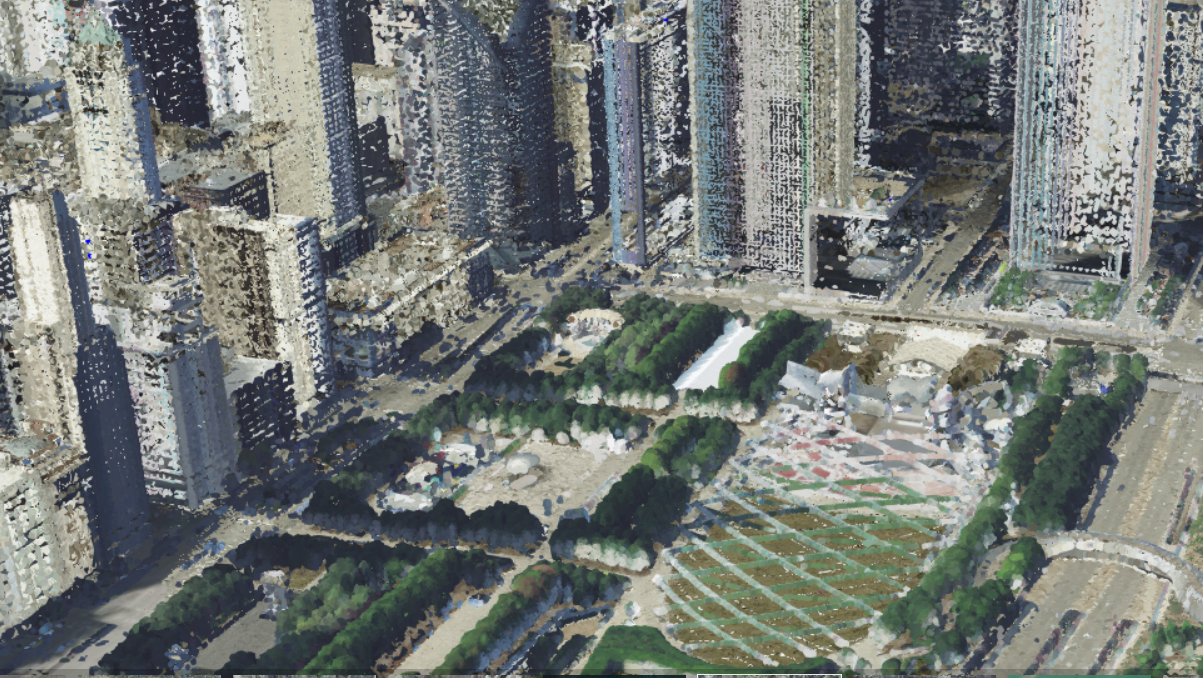
Aquí hay otra vista alejada:<\/P>
Y otra más alejada aún:<\/P>
Algunas de las escenas anteriores usan imágenes NAIP en lugar de imágenes de mayor resolución. ¿Por qué, cuando hay mayor resolución disponible? A menudo, la imagen de alta resolución es algo oblicua donde NAIP se recoge usualmente desde una altitud más alta. Con la altitud más alta, se obtiene menos inclinación de edificios en la imagen y a menudo el espaciamiento del lidar no soporta la imagen de mayor resolución. En estos casos, NAIP suele ser preferido, pero haz nubes de puntos con un par de archivos las para ver cuáles son las diferencias.<\/P>
Aquí hay uno sobre Fairfax County, VA, usando su lidar colorizado publicado (desde su
\n
\n <\/>\n
Con edificios grandes, los lados y techos del edificio usando intensidad para simbología realmente muestran el detalle. Los lados de los edificios son solo representativos, no muestran cómo lucen realmente los lados.<\/> <\/>
Abajo hay algo del trabajo con el que ayudé al Estado de Kentucky. El resultado es similar en algunos aspectos al trabajo de los neoimpresionistas Georges Seurat y Paul Signac que pionearon una técnica pictórica llamada Puntillismo. <\/P>
Lidar colorizado Kentucky:<\/P>
Con la ilusión de paredes añadidas y techo engrosado (Cumberland, KY):<\/P>
Aquí hay otra vista que muestra los lados del edificio:<\/P>
Es una ilusión con los lados de los edificios, los colores no coinciden con el lado real de los edificios y las diferencias en la intensidad del lidar usado no muestran las verdaderas diferencias en los lados como las ventanas percibidas arriba. Como la mayoría de las ilusiones o representaciones, engaña a los ojos haciéndoles pensar que son los lados de los edificios. A veces, como la mayoría de las ilusiones o representaciones, no funciona desde todos los ángulos como este edificio con una baja cantidad de puntos:<\/P>
En general, creo que los lados representativos te ayudan a identificar qué es un edificio y qué no lo es. Los colores de los lados del edificio no coincidirán con la realidad, ni muestran verdaderas ventanas o verdaderas puertas. Hacerlo suele ser un proceso muy costoso y que consume mucho tiempo después de generar modelos 3D de los edificios. Todavía podrías generar los edificios 3D con la Local Government 3D Basemap Solution para ArcGIS Pro y tenerlos semi-transparentes para usarlos en selección y análisis sin ningún coloreado. También podrías usar rpks aplicados a los edificios para representar los modelos 3D más precisamente, pero esto sería nuevamente una representación sin datos muy detallados. <\/P>
Cómo obtener Lidar fácilmente para áreas grandes:<\/STRONG> Aquí hay un
Cubriendo lo básico sobre Nubes de Puntos Lidar Colorizadas, creación de paquetes de capas escena y visualización:<\/STRONG><\/P>Aquí hay un
Enlace:
Bahía Barneget (New Jersey, US)
Nube de puntos Ciudad de Denver (Colorado, US)
Ciudad de Redlands (California, US)
Prueba Lidar Kentucky (Cumberland, Kentucky, US)
Lewisville, TX, US (cerca de Dallas)
<\P>
Añadiré más a este blog en el futuro, manténganse atentos.<\\STRONG>
</p>
Hi! Interesting blog. I noticed you have Barnegat Bay Scene Viewer listed under the examples of some colorized lidar to look at. Barnegat Bay is in New Jersey, for those who are curious!
Hi Trish, thanks for the comment. I added the location to it.
Arthur
Hi Arthur - really interesting blog.
I have a question that is semi-related to your blog entry -- more specifically related to your #3 step towards the end of the blog: 3. Looked at the projection in the reports in the meta data downloaded and found it was not supported because it used meters instead of feet, modified a projection and then copied it using a simple model builder tool to give a projection file to each LAS file.
When you say "modified a projection", what exactly are you doing in ArcGIS Pro? I have a las file with a known projection and vertical coordinate system (NAD 1983 (2011) UTM Zone 18N, NAVD88 height - Geoid12A (metres)) but when I generate the las dataset it floats above the surface. This suggests to me that I have in an incorrect vertical reference so I'm trying to figure out how to modify the projection or reproject the lasd to get the stars to align.
See below.
Any thoughts?
Hello John,
What I did was saw the vertical projection in meters, but the one list was in feet. Here's the text in that projection file: USGS_LPC_CA_Wildfires_B1_2018_w1927n1436_LAS_2019.prj
PROJCS["NAD_1983_2011_Contiguous_USA_Albers",GEOGCS["GCS_NAD_1983_2011",DATUM["D_NAD_1983_2011",SPHEROID["GRS_1980",6378137.0,298.257222101,AUTHORITY["EPSG",7019]],AUTHORITY["EPSG",1116]],PRIMEM["Greenwich",0.0,AUTHORITY["EPSG",8901]],UNIT["Degree",0.0174532925199433,AUTHORITY["EPSG",9102]],AUTHORITY["EPSG",6318]],PROJECTION["Albers",AUTHORITY["Esri",43007]],PARAMETER["False_Easting",0.0,AUTHORITY["Esri",100001]],PARAMETER["False_Northing",0.0,AUTHORITY["Esri",100002]],PARAMETER["Central_Meridian",-96.0,AUTHORITY["Esri",100010]],PARAMETER["Standard_Parallel_1",29.5,AUTHORITY["Esri",100025]],PARAMETER["Standard_Parallel_2",45.5,AUTHORITY["Esri",100026]],PARAMETER["Latitude_Of_Origin",23.0,AUTHORITY["Esri",100021]],UNIT["Meter",1.0,AUTHORITY["EPSG",9001]],AUTHORITY["EPSG",6350]],VERTCS["NAVD88 (height) (ftUS)_1",VDATUM["North_American_Vertical_Datum_1988",AUTHORITY["EPSG",5103]],PARAMETER["Vertical_Shift",0.0,AUTHORITY["Esri",100006]],PARAMETER["Direction",1.0,AUTHORITY["Esri",100007]],UNIT["Meter",1.0,AUTHORITY["EPSG",9001]]]
Where the "Meter" is was originally "Feet", so I changed it. You can do this manually or in ArcGIS Pro by modifying the projection and saving it. I created a simple model with an iterator that would run through the las files and copy the projection file so it would match each las file.
It's looks to me yours might be in meters, but need to be set to feet, from the image you shared. Basically, the opposite of what I did with the Redlands lidar. You can create a projection file for one tile, change it from meters to feet and see if it works.
Here's one that might work, copy and paste below into a txt file. Then rename with las name and change from .txt file to .prj.
PROJCS["NAD_1983_2011_UTM_Zone_18N",GEOGCS["GCS_NAD_1983_2011",DATUM["D_NAD_1983_2011",SPHEROID["GRS_1980",6378137.0,298.257222101]],PRIMEM["Greenwich",0.0],UNIT["Degree",0.0174532925199433]],PROJECTION["Transverse_Mercator"],PARAMETER["False_Easting",500000.0],PARAMETER["False_Northing",0.0],PARAMETER["Central_Meridian",-75.0],PARAMETER["Scale_Factor",0.9996],PARAMETER["Latitude_Of_Origin",0.0],UNIT["Meter",1.0],AUTHORITY["EPSG",6347]],VERTCS["NAVD88_height_(ftUS)",VDATUM["North_American_Vertical_Datum_1988"],PARAMETER["Vertical_Shift",0.0],PARAMETER["Direction",1.0],UNIT["Foot_US",0.3048006096012192],AUTHORITY["EPSG",6360]]
I'll be on the question and answer team for the Imagery Showcase booth this year for Elevation and Lidar if you want to ask some questions in person.
Thanks,
Arthur Crawford
Living Atlas Team/Community Maps
Thanks Arthur!
I was able to resolve my vertical problem. I will seek out the Imagery Showcase booth (virtually) with other questions I have.
Speaking of which, I get to the Colorize Las stage of your workflow and no matter what adjustments I make to the tool settings, I still just end up with a grey colorized lasd. I'm thinking I must be missing something really basic but the solution hasn't been forthcoming! See attached.
It looks like you are using NAIP as an imagery source. Did you download the NAIP locally and is it matching the area of the point cloud?
Arthur Crawford - Esri
Thanks, Arthur. I did download the NAIP locally and it matched the area of the point cloud, so I'm not sure what the issue was.
However, I performed the same colorization using ESRI's NAIP service and it worked perfectly!
Thanks again.
Arthur CrawfordIs there a way to smooth multipatch?
Hi Rickey, good to hear from you. How's Ashland theses days? There is not a real good way to do that right now. It's something we have asked for, several universities and companies are working on. The goal would be to take a tin building and then flatten the roofs, superstructure and the sides of the buildings. I assume this is a building generated from a tin approach. There is some ideas of taking the planes generated to extend to the outside of the building polygon. Have you tried to segment roof tool with the Local Government 3D Basemap Solution?
Arthur Crawford
This was made from lidar points using LAS building Multipatch. I have tried different Simplification Tolerance but I have found one that works.
Hi Rickey,
Is your intent to use the multipatches for analysis and use a colorized point cloud for rendering? I did something like that for Chicago using the LOD1/LOD2 buildings with a transparency. With the 3D trees in as multipatches as per the Local Government 3D Basemap, you could do some nice 3D analysis like line of sight or flood estimations with it. With both set to a 100% transparency, then use the point cloud for rendering quickly.
At this point whatever I can display nicely online is what I will go with.
Hi @ArthurCrawford,
Very cool looking scenes!
Can you colorize a point cloud scene layer with imagery?
Simon
@ArthurCrawford I wanted to share the St. Louis imagery web app linked in the blog (https://www.arcgis.com/home/webscene/viewer.html?webscene=6ece8b4050294139969fc4c10ad6b9b1) with my students in a Geovisualization and Cartography class. When we log in to our org we can see it, but we get a few layers that are "service not found" or "You do not have permission to access this resource". They are:
St Louis Iconic Waterfront Features 3D
City of St. Louis Lidar Dec 2016 Colorized
CityofStLouis_6_27_2018
Was trying to show them how the Colorize LAS tool worked and our computers were not happy (end of semester and not great graphics cards) but the colorized lidar was not showing up in this. 🙂 Thanks in advance.
Best, @shannonhwhite (not sure why its not defaulting to my wm-gis org account but either way I will get it).
Los miembros registrados pueden publicar, seguir actualizaciones y más. ¿Nuevo aquí? Regístrate gratis.
Find useful guides, FAQs, and documents to help you navigate and make the most of Esri Community.